NBIS Q2 FY2026: Our March Thesis After a 126% Run
Key Takeaway
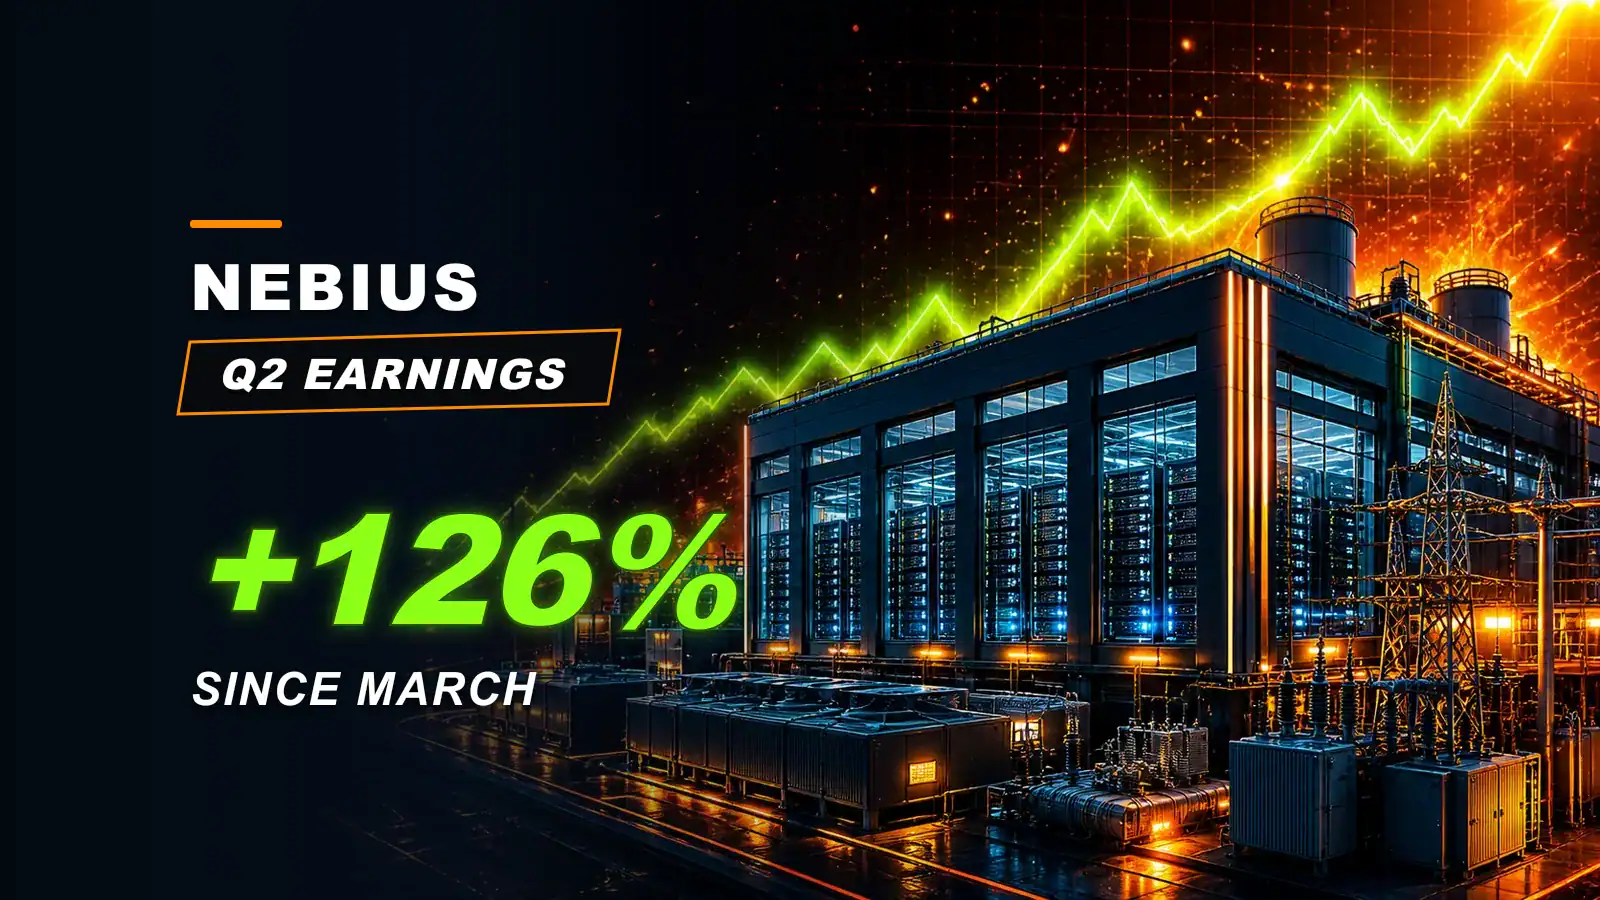
AIStocksHub’s March 14 Nebius thesis centered on major contracts, Nvidia validation, and scarce AI-compute capacity. Since the prior trading close, NBIS has gained about 126%. Q2 strengthened that thesis, but today’s larger capex, debt, and dilution make the risk-reward less asymmetric.
Introduction and immediate market reaction
Nebius reported Q2 FY2026 results before the August 12 market open. Revenue grew 454%, adjusted EBITDA turned positive, and AI-cloud demand supported another capacity increase. The release moved the debate from demand validation toward funding and delivery.
NBIS closed at $193.23 on August 11, immediately before the report. It jumped 34.1% to $259.20 on August 12, then closed at $255.04 on August 13. Therefore, shares remained 32.0% above their pre-earnings close after the initial pullback.
The longer timeline matters even more. AIStocksHub published its original analysis and companion video on March 14, after a $112.95 prior-session close. The August 13 close represents a 125.8% simple price gain from that baseline.
Educational disclaimer
This article is educational, informational research—not financial advice.
We strive to keep data accurate, but unavoidable errors or omissions may occur. Verify important information with primary sources.
What investors expected before earnings
Selected consensus expected $576.74 million of revenue and an adjusted loss of $0.82 per share. Investors also wanted evidence that signed contracts were becoming revenue. Meanwhile, the rising share price created a demanding bar for forward capacity and profitability.
The central question was no longer whether customers wanted AI compute. Microsoft and Meta commitments had already supported that case. Instead, investors needed proof that Nebius could deploy capacity, improve deal economics, and finance growth.
Reported versus expected scoreboard
Nebius narrowly exceeded the selected revenue estimate and delivered a much smaller adjusted loss. The adjusted EPS comparison comes from one consensus provider. Nebius separately reported a GAAP diluted loss of $0.68 per share.
| Metric | Reported | Expected | Surprise | Year-over-year |
|---|---|---|---|---|
| Revenue | $582.30M | $576.74M | +1.0% | +454% |
| Adjusted EPS | -$0.12 | -$0.82 | $0.70 better | Improved from -$0.38 |
The EPS distinction is important. Adjusted EPS excludes items that remain real to shareholders, while GAAP EPS follows accounting rules. The quarter looked stronger on an adjusted basis than on a GAAP basis.
Revenue segments and AI performance
Nebius AI produced almost all group revenue and grew faster than the consolidated business. Its annualized run-rate revenue reached $3.0 billion. However, that metric annualizes the latest month and does not equal GAAP backlog.
| Metric | Q2 FY2026 | Q2 FY2025 | Year-over-year |
|---|---|---|---|
| Group revenue | $582.3M | $105.1M | +454% |
| Nebius AI revenue | $574.9M | About $93.6M | +514% |
| Annualized run-rate revenue | $3.0B | About $430M | +598% |
Commercial momentum extended beyond recognized revenue. Nebius signed four landmark AI-cloud deals averaging more than $1 billion of total contract value. Total Q2 contract value was nearly four times Q1, while new-customer contract value exceeded nine times Q1.
Still, contract value is not current revenue. Most landmark deals use capacity arriving late in 2026 and should contribute mainly during 2027. Investors must track actual deployment and revenue conversion.
Margins, cash flow, and capital spending
Group adjusted EBITDA improved to $236.2 million from a $21.0 million loss. Nebius AI produced $285.7 million of adjusted EBITDA and a 49.7% margin. That operating leverage supports the full-stack AI-cloud thesis.
| Metric | Q2 FY2026 | Q2 FY2025 | Change |
|---|---|---|---|
| Group adjusted EBITDA | $236.2M | -$21.0M | Turned positive |
| Operating cash flow | $2.246B | -$167.9M | Turned positive |
| Capital expenditures | $5.657B | $510.6M | +1,008% |
The cash-flow picture needs context. Customer prepayments helped operating cash flow, yet capital expenditures exceeded it by roughly $3.41 billion. This remains an infrastructure buildout, not a capital-light software story.
Nebius ended June with $8.04 billion of cash and equivalents. However, noncurrent debt stood at $8.50 billion. The balance sheet can support expansion, but funding choices now matter almost as much as customer demand.
Updated guidance
Management reaffirmed its full-year revenue, annualized run-rate, and adjusted EBITDA margin targets. It also raised the end-2026 contracted-power forecast to 5 gigawatts. The higher power target expands the opportunity and the execution burden.
| Metric | Q2 update | Prior position | Change |
|---|---|---|---|
| FY2026 group revenue | $3.0B-$3.4B | $3.0B-$3.4B | Reaffirmed |
| End-2026 annualized run-rate revenue | $7B-$9B | $7B-$9B | Reaffirmed |
| FY2026 group adjusted EBITDA margin | Around 40% | Around 40% | Reaffirmed |
| End-2026 contracted power | 5 GW | More than 4 GW | Raised |
First-half revenue totaled $981.3 million. Consequently, Nebius needs about $2.02 billion to $2.42 billion during the second half. That requirement makes capacity delivery the clearest test of guidance.
Market expectations
A selected August 13 market-consensus snapshot showed 11 Buy, six Hold, and one Sell recommendation. These ratings reflect third-party opinions from the prior three months. They are neither company facts nor investment instructions.
| Rating | Analyst count |
|---|---|
| Buy | 11 |
| Hold | 6 |
| Sell | 1 |
The same provider displayed a wide target range around the August 13 closing price. Notably, the average target offered only modest upside after the earnings jump.
| Price reference | Value |
|---|---|
| Current share price, August 13 close | $255.04 |
| Lowest price target | $144.00 |
| Average price target | $263.31 |
| Highest price target | $410.00 |
The average target sat only 3.2% above the closing price. However, analyst estimates can change quickly after a major earnings reaction. The broad range also shows how uncertain Nebius’s valuation remains.
Management commentary
Management emphasized better contract economics and new funding structures. About 70% of Q2 deals included prepayments covering 50% to 60% of related capital spending. Nebius now expects more than $9 billion of customer prepayments during 2026.
The company also described more than $40 billion of customer commitments. Meanwhile, estimated payback on Q2 deals improved to one year and ten months. Those figures suggest stronger demand and better customer-funded growth.
Nevertheless, commitments and prepayments require careful interpretation. They do not guarantee the timing or amount of recognized revenue. Execution still depends on power, chips, construction, networking, and customer acceptance.
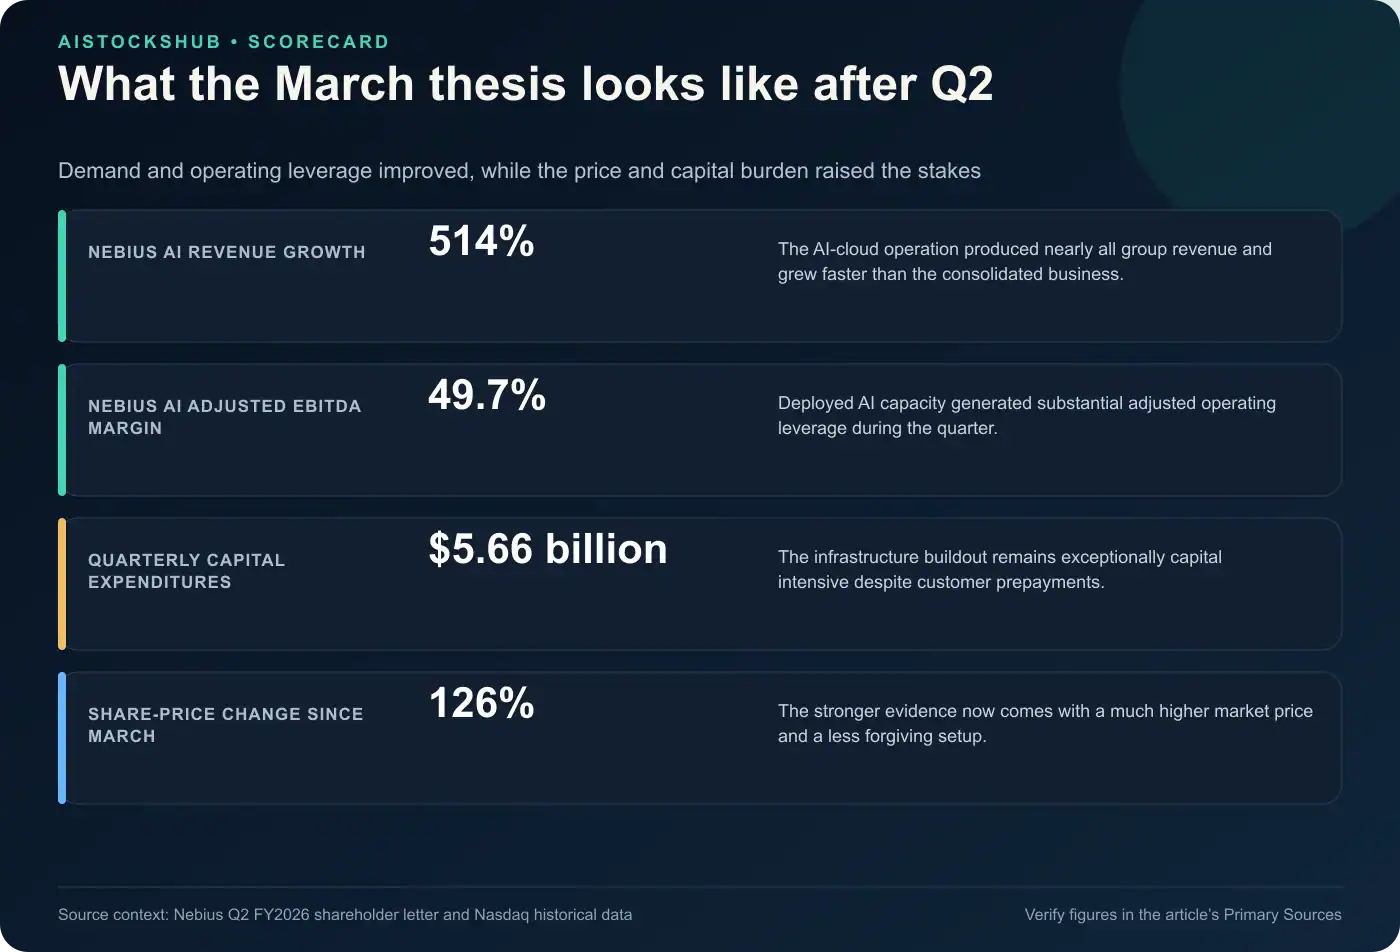
What improved versus what disappointed
Revenue growth, adjusted EBITDA, and AI-cloud margins all improved. Deal volume accelerated, while prepayments reduced the immediate funding burden. The raised power target also showed confidence in future demand.
However, GAAP results remained negative. Nebius reported a $190.4 million net loss from continuing operations and a $175.9 million operating loss. Share-based compensation also rose sharply to $102.5 million.
Capital intensity was the largest disappointment. Quarterly capex reached $5.66 billion, more than ten times the prior-year amount. Strong demand matters only if new capacity earns acceptable returns after financing costs and dilution.
Why the stock moved
The market reaction was not driven by the 1% revenue beat alone. Investors also saw a much smaller adjusted loss, positive adjusted EBITDA, and stronger deal economics. Together, those details improved confidence in conversion and profitability.
Forward demand supplied the larger catalyst. The four landmark deals, customer prepayments, and 5-gigawatt power target pointed toward rapid 2027 growth. The stock move reflects that future capacity more than one quarter of revenue.
Finally, Q2 reduced one major uncertainty: whether Nebius could monetize its infrastructure quickly. It did not remove financing or delivery risk. Instead, the quarter shifted the market’s attention toward those next constraints.
Before-versus-after investment thesis
Our March thesis emphasized specialized AI infrastructure, Microsoft and Meta contracts, Nvidia alignment, and scarce compute capacity. Those were business drivers, not a prediction of an exact price or date. The stock’s later gain does not make every original assumption automatically correct.
What did the thesis get right? Contracts and capacity became the main engines of growth. Q2 revenue, run-rate revenue, and deal activity show that customers are paying for the infrastructure Nebius was building.
Yet the thesis has changed after a 126% run. In March, the key question was whether demand could validate the buildout. Today, the harder questions involve valuation, capital efficiency, financing, dilution, and delivery at unprecedented scale.
Nebius sold 12.7 million shares through its at-the-market program by June 30. Those sales raised about $2.8 billion at a $223.60 weighted average price. Another 12.3 million shares remained available under the program.
Therefore, the business thesis looks stronger while the investment setup looks less forgiving. That distinction is the most important lesson from revisiting an early call. Better fundamentals do not automatically mean better forward returns at every price.
Post-earnings bull case
The bull case begins with growth and operating leverage. Nebius AI revenue rose 514%, while its adjusted EBITDA margin reached 49.7%. Few infrastructure platforms are scaling both measures this quickly.
Customer funding strengthens the case. Prepayments cover a large share of associated capex, and Q2 deal payback improved materially. The asset-light partnership model could also expand capacity without placing every dollar on Nebius’s balance sheet.
Finally, supply remains valuable. Nebius raised contracted power to 5 gigawatts and plans to deploy more than one gigawatt annually from 2027. Successful delivery could turn today’s commitments into much larger recognized revenue.
Post-earnings bear case
The bear case starts with capital intensity. Nebius spent $5.66 billion on capex during one quarter and carried $8.50 billion of noncurrent debt. Customer prepayments help, but they do not eliminate construction or financing risk.
Dilution creates another concern. The company issued millions of shares and retained additional ATM capacity. Future equity sales could reduce each existing shareholder’s ownership percentage.
Valuation also became less comfortable. The August 13 close sat near the selected average analyst target. A delayed deployment, lower utilization, weaker pricing, or customer concentration problem could create a sharp reset.
What to watch before the next quarter
First, track second-half revenue against the $2.02 billion to $2.42 billion required for guidance. Then compare year-end annualized run-rate revenue with the $7 billion to $9 billion target. Both measures depend on capacity arriving on schedule.
Next, watch customer prepayments, capex, debt, and new share issuance together. A large contract can look impressive while producing weak shareholder economics. Funding quality will reveal whether growth is becoming more efficient.
Finally, monitor Microsoft deliveries, the second Meta agreement, and customer diversification. Management says Meta-related capacity remains on track for early 2027. Any delay would move revenue while costs continue accumulating.
Final earnings verdict
Nebius delivered a powerful Q2 FY2026. Revenue grew 454%, adjusted EBITDA turned positive, and large deals strengthened visibility. The report validated several drivers highlighted in AIStocksHub’s March research.
However, this is not the same setup investors faced in March. The share price is 126% higher, capex has surged, debt has expanded, and dilution is visible. The thesis deserves more confidence, but the stock deserves more scrutiny.
The balanced verdict is straightforward. AIStocksHub identified the right strategic variables before the major run, and Q2 supplied stronger evidence. From here, capacity conversion and capital efficiency matter more than retrospective celebration.
Primary Sources
- Nebius Q2 2026 shareholder letter
- Nebius Q2 2026 financial-results announcement
- Nebius Q2 2026 earnings release
- Nasdaq NBIS historical data
- AIStocksHub’s March 2026 Nebius analysis
- AIStocksHub’s March 2026 Nebius video
FAQ
Has NBIS gained more than 100% since AIStocksHub’s March analysis?
Yes. NBIS rose from the $112.95 prior-session close to $255.04 on August 13. That equals a 125.8% simple price gain.
Did Nebius beat Q2 FY2026 expectations?
Yes, using the selected consensus dataset. Revenue beat by about 1%, while the adjusted loss was $0.70 per share better. GAAP diluted EPS was negative $0.68.
What did the March NBIS thesis identify?
It focused on major AI-cloud contracts, Nvidia ecosystem validation, and scarce compute capacity. It also identified capital intensity, concentration, and execution as meaningful risks.
What is Nebius’s FY2026 revenue guidance?
Management reaffirmed group revenue of $3.0 billion to $3.4 billion. It also maintained a $7 billion to $9 billion year-end annualized run-rate target.
What is the biggest NBIS risk after earnings?
The biggest risk is converting a huge infrastructure buildout into attractive shareholder returns. Capex, debt, dilution, customer concentration, and deployment timing all affect that outcome.
Is annualized run-rate revenue the same as backlog?
No. Nebius annualizes its latest monthly revenue to calculate that measure. It is not GAAP revenue, backlog, or total contract value.