NVIDIA Corporation Q2 FY2027: Why NVDA Stock Jumped 8.7%
Key Takeaway
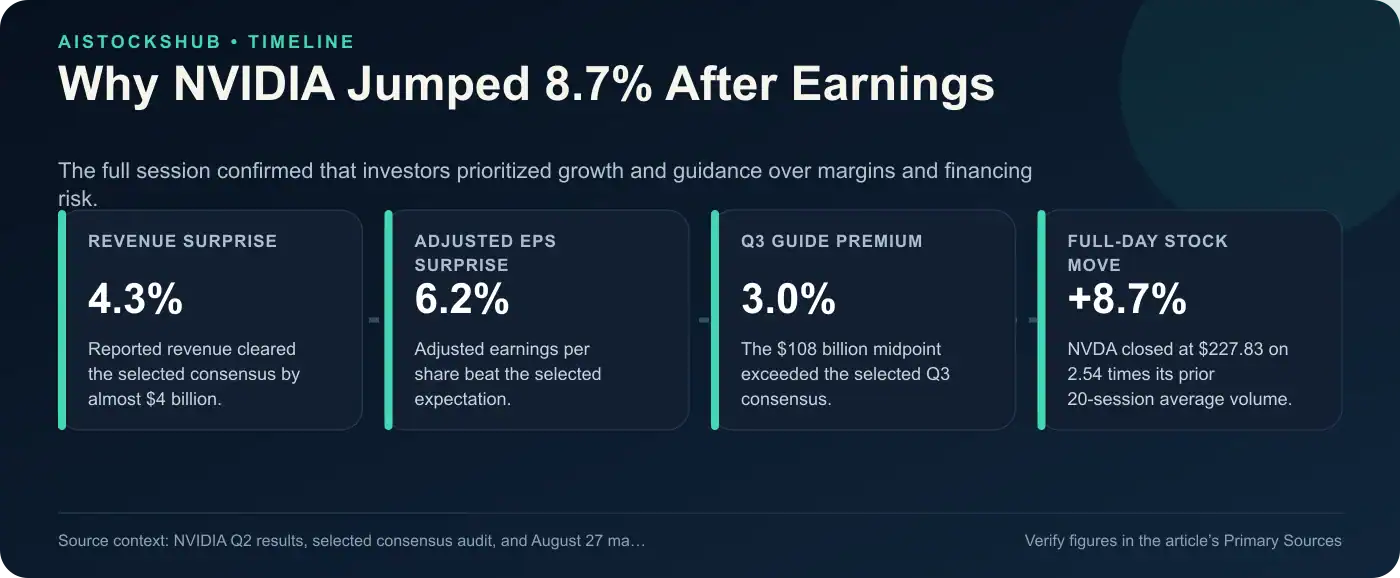
NVIDIA delivered a powerful quarter, and the first complete trading session gave investors a decisive verdict. NVDA closed at $227.83 on August 27, up 8.7% from its $209.66 pre-earnings close. The rally held throughout the day on roughly 296.6 million shares, about 2.54 times the prior 20-session average.
Three earnings numbers drove the move:
- Revenue reached $96.2 billion, about $4.0 billion above a selected Wall Street consensus.
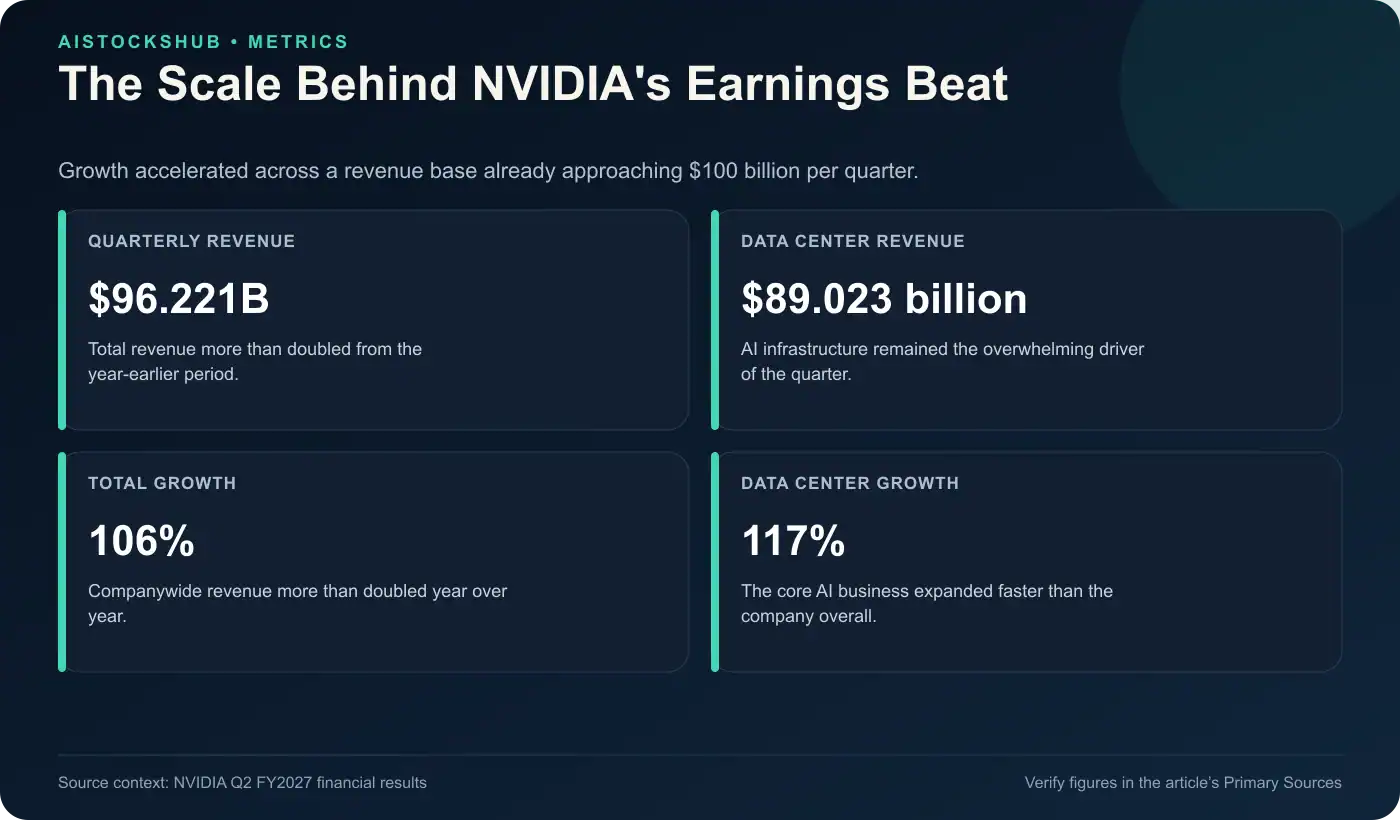
- Data Center revenue hit $89.0 billion, representing roughly 92.5% of total sales.
- Management guided Q3 revenue to $108 billion, about 3% above the selected consensus at the midpoint.
The full-day gain confirms that investors prioritized NVIDIA’s growth and outlook over near-term margin and cash-conversion concerns. However, the report did not eliminate the longer-term debate. NVIDIA’s customer payment terms, supply commitments, and AI-infrastructure financing exposure now deserve as much attention as GPU demand.
Introduction and immediate market reaction
NVIDIA Corporation reported Q2 FY2027 results after the market closed on August 26, 2026. The quarter ended July 26. For readers who want more background on the business before studying the quarter, our NVIDIA stock hub explains its position in the AI computing stack and collects current coverage.
NVDA closed at $209.66 before the report. Shares initially fell after hours, then reversed to a time-stamped $218.91 indication as the earnings call progressed. The next day’s regular session confirmed and extended that reversal.
On August 27, NVDA opened at $222.79, reached a low of $220.92, climbed as high as $230.47, and closed at $227.83. The close represented an 8.7% one-session gain and sat only about 1.1% below the intraday high. In addition, volume reached approximately 296.6 million shares, about 154% above the prior 20-session average of 116.7 million shares. All volume comparisons are AIStocksHub calculations based on the completed regular-session dataset.
The broader market rallied too, but much less. The Nasdaq Composite gained 1.6%, while the S&P 500 rose 0.7%. Therefore, NVIDIA outperformed those benchmarks by roughly 7.1 and 8.0 percentage points, respectively. The evidence points to a company-specific earnings reaction that also helped lift the wider technology market.
Educational disclaimer
This article is educational, informational research—not financial advice.
We strive to keep data accurate, but unavoidable errors or omissions may occur. Verify important information with primary sources.
What investors expected before earnings
Expectations were already demanding. A selected Wall Street consensus called for $92.27 billion in revenue and $2.09 in adjusted earnings per share. Investors also expected Data Center sales of roughly $85.7 billion and Q3 revenue near $104.86 billion.
Those targets framed the real question. A normal beat would not necessarily satisfy a market that had priced NVIDIA as the primary beneficiary of global AI-infrastructure spending. Investors needed both a strong quarter and evidence that growth could continue at enormous scale.
Reported versus expected scoreboard
| Metric | Reported | Expected | Surprise | Investor read |
|---|---|---|---|---|
| Revenue | $96.221B | $92.27B | +$3.951B, or about 4.3% | Clear beat |
| Adjusted diluted EPS | $2.22 | $2.09 | +$0.13, or about 6.2% | Clear beat |
| Data Center revenue | $89.023B | About $85.7B | About +$3.3B | AI demand remained strong |
| Q3 revenue outlook | $108B midpoint | $104.86B | +$3.14B, or about 3.0% | Better-than-expected guide |
NVIDIA also exceeded its own prior guidance. In May, management projected Q2 revenue of $91 billion, plus or minus 2%. The final result came in $5.221 billion, or about 5.7%, above that midpoint.
Revenue segments and AI performance
Total revenue rose 106% year over year and 18% sequentially. Data Center revenue grew even faster, increasing 117% year over year to $89.023 billion.
| Revenue category | Q2 FY2027 | Sequential growth | Year-over-year growth |
|---|---|---|---|
| Hyperscale | $48.710B | 13% | 102% |
| AI Clouds, Industrial & Enterprise | $40.313B | 25% | 138% |
| Edge Computing | $7.198B | 13% | 27% |
| Total Data Center | $89.023B | 18% | 117% |
The fastest growth came from AI clouds, industrial customers, and enterprise buyers. That mix matters because it suggests demand has broadened beyond the largest hyperscalers. NVIDIA said systems were being deployed through partners including CoreWeave and Oracle, as well as other cloud providers.
Still, concentration remains high. Data Center generated about 92.5% of company revenue, and one direct customer represented 16% of quarterly sales. NVIDIA also disclosed that China shipments of Data Center Hopper products remained below 1% of Data Center revenue.
Margins, cash flow, and capital spending
Gross margin held up well in Q2. Both GAAP and adjusted gross margin were 75.0%, compared with a 74.9% GAAP margin and 75.0% adjusted margin in Q1. The result showed that rapid system growth had not yet broken the company’s recent margin range.
Operating results were strong. GAAP operating income reached $63.7 billion, up 124% year over year. GAAP net income totaled $59.7 billion, while adjusted net income was $54.0 billion.
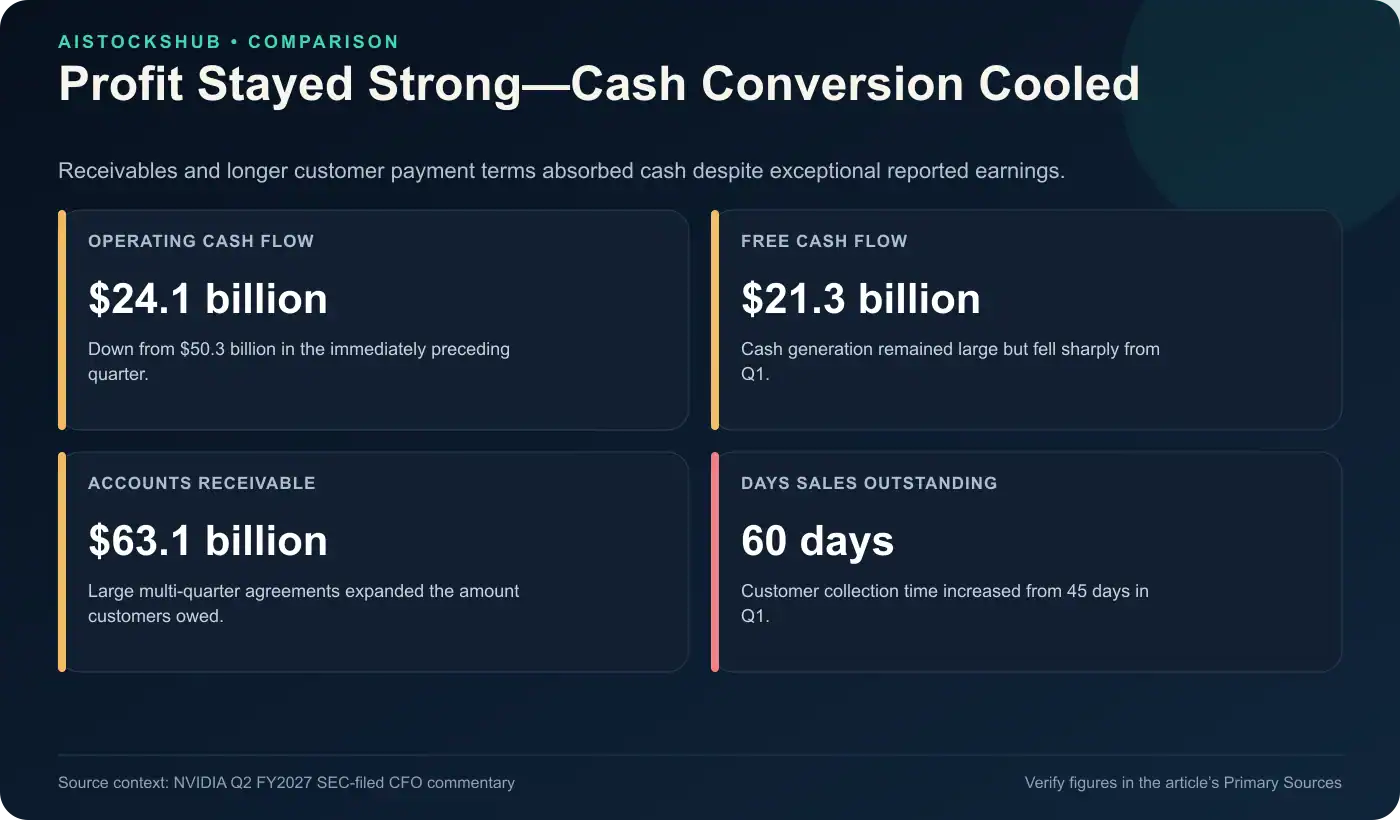
Cash flow needs more context. Operating cash flow fell to $24.1 billion from $50.3 billion in Q1, while free cash flow declined to $21.3 billion from $48.6 billion. The decline did not come from weak reported profit. Instead, receivables and customer payment terms absorbed cash.
Accounts receivable rose to $63.1 billion, and days sales outstanding increased to 60 days from 45 days in Q1. NVIDIA tied that change to extended payment terms on large, multi-quarter agreements with investment-grade customers. Inventory also climbed to $31.6 billion from $25.8 billion as the company prepared for Vera Rubin systems.
| Operating metric | Q2 FY2027 | Q1 FY2027 | Q2 FY2026 |
|---|---|---|---|
| GAAP gross margin | 75.0% | 74.9% | 72.4% |
| Operating cash flow | $24.077B | $50.344B | $15.365B |
| Free cash flow | $21.341B | $48.554B | $13.450B |
| Inventory | $31.6B | $25.8B | Not used in this comparison |
Meanwhile, NVIDIA returned almost $26 billion through repurchases and dividends. It ended the quarter with $56.6 billion in cash, cash equivalents, and marketable debt securities, plus $99.3 billion of remaining repurchase authorization.
Updated guidance
Management expects Q3 FY2027 revenue of $108 billion, plus or minus 2%. That creates a range of roughly $105.84 billion to $110.16 billion. Even the low end stands above the selected $104.86 billion consensus.
| Q3 FY2027 item | NVIDIA guidance | Change or context |
|---|---|---|
| Revenue | $108B, ±2% | Midpoint about 3.0% above selected consensus |
| GAAP gross margin | 74.0%, ±0.5 percentage point | Down 1 percentage point from Q2 midpoint |
| Adjusted gross margin | 74.0%, ±0.5 percentage point | Same expected sequential compression |
| GAAP operating expenses | About $9.2B | Investment continues to rise |
| Adjusted operating expenses | About $9.0B | Supports product and infrastructure expansion |
The guide assumes no Data Center compute revenue from China. Therefore, the outlook does not depend on a recovery in that restricted market. The tradeoff is margin: the 74% midpoint implies about 100 basis points of sequential compression.
Market expectations
NVIDIA entered the report with unusually bullish sell-side expectations. As of August 26, 2026, one selected market-consensus provider showed 58 Buy, two Hold, and one Sell rating. The provider’s same-day snapshot listed an average target of $305.41, a lowest target of $180, and a highest target of $500.
| Analyst snapshot | Value |
|---|---|
| Buy ratings | 58 |
| Hold ratings | 2 |
| Sell ratings | 1 |
| Price comparison | Price | Versus August 27 close |
|---|---|---|
| August 27 regular-session close | $227.83 | Baseline |
| Average price target | $305.41 | 34.1% above current |
| Highest price target | $500.00 | 119.5% above current |
| Lowest price target | $180.00 | 21.0% below current |
These targets are not guarantees, and their value depends on assumptions about growth, margins, capital intensity, and valuation. More importantly, they show how high the bar had become before NVIDIA reported.
Management commentary
Management argued that AI computing demand still exceeds available supply. During the call, NVIDIA discussed the potential for roughly 70% revenue growth in fiscal 2028 under current supply assumptions. It also said customer forecasts could support much more demand if enough systems were available.
The message was not simply that Blackwell demand remains strong. NVIDIA is now planning for a broader buildout that includes Vera Rubin production, AI factories, networking, cloud capacity, land, power, and financing relationships. As a result, execution increasingly depends on an ecosystem rather than a single product cycle.
That expansion changes the story. NVIDIA is no longer only selling chips into the buildout. It is also helping organize the capital and capacity needed to keep the buildout moving.
What improved versus what disappointed
The quarter produced three clear improvements:
- Revenue, adjusted EPS, and Data Center sales all exceeded selected expectations.
- Q3 revenue guidance was stronger than the market expected, even without assumed China Data Center compute sales.
- Gross margin held at 75% in Q2 despite rapid product transitions and system-level growth.
However, three areas require caution:
- Free cash flow fell sharply from Q1 as receivables and extended payment terms increased.
- The Q3 gross-margin midpoint declined to 74%.
- Supply commitments, cloud-service purchases, leases, investments, and guarantees expanded rapidly.
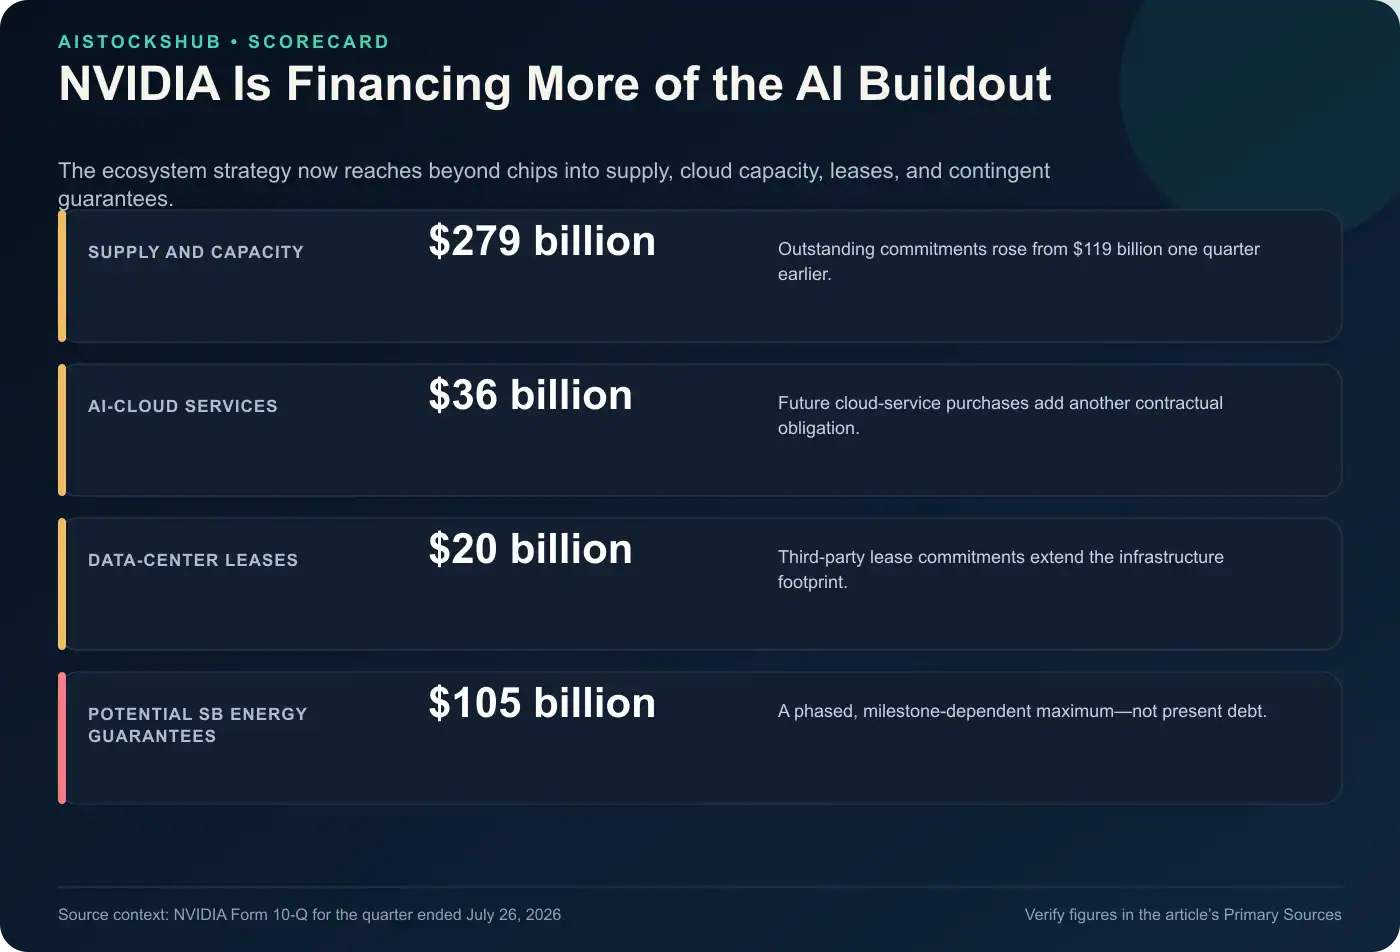
The last point may be the most important. NVIDIA disclosed $279 billion of supply and capacity commitments, up from $119 billion one quarter earlier. It also listed $36 billion of future AI-cloud service commitments and $20 billion of third-party data-center lease commitments.
In addition, NVIDIA described guarantees connected to selected AI-cloud providers. An August arrangement involving SB Energy could expose the company to guarantees of up to $105 billion for OpenAI-affiliate lease obligations across approximately 4.25 gigawatts. Those projects are phased, depend on future milestones, and are not the same as current debt. Still, they create contingent risk that investors should track.
Why the stock moved
The first after-hours decline likely reflected the parts of the report that challenged the cleanest bull narrative:
- Q3 gross margin is expected to decline.
- Operating and free cash flow fell substantially from Q1.
- Receivables and payment terms increased.
- The 10-Q revealed much larger supply, capacity, investment, and guarantee exposure.
The later recovery and the 8.7% full-session rally reflected a different set of facts:
- Revenue and adjusted EPS beat consensus.
- Data Center revenue remained exceptionally strong.
- The $108 billion Q3 outlook exceeded expectations.
- Management indicated that supply, not demand, remains the principal growth constraint.
The price path strengthened that interpretation. NVDA opened 6.3% above its pre-earnings close, never traded below a 5.4% gain, and finished near the session high on unusually heavy volume. In other words, the market did not merely preserve the after-hours bounce. It increased its conviction during regular trading.
This is AIStocksHub’s interpretation of the completed reaction, not a company statement. The broader market’s advance helped sentiment, but NVIDIA’s much larger gain and heavy volume show that the earnings report was the dominant catalyst.
Before-versus-after earnings thesis
| Thesis question | Before Q2 results | After Q2 results |
|---|---|---|
| Is AI infrastructure demand slowing? | A major concern because expectations were extreme | Reported growth and guidance do not show a near-term slowdown |
| Can NVIDIA sustain 75% gross margin? | High-margin durability was central to valuation | Q2 held at 75%, but Q3 points to 74% |
| Is supply the constraint? | Widely assumed | Management reinforced that view and expanded commitments |
| Is the business becoming more capital-intensive? | Growing concern | Yes; commitments, leases, investments, and guarantees increased materially |
| Does China drive the next-quarter guide? | Uncertain | No China Data Center compute revenue is assumed |
| Did the market accept the quarter? | The initial after-hours response was mixed | Yes; NVDA gained 8.7% on 2.54 times its prior 20-session average volume |
The central thesis improved on demand visibility but became more complicated on financial structure. Investors received stronger evidence that customers want more AI computing. They also received stronger evidence that NVIDIA may deploy its balance sheet and contractual capacity to help customers obtain it.
Post-earnings bull case
The bull case starts with growth. A company already operating at a massive revenue base more than doubled sales year over year and still guided above consensus. Data Center growth remained broad, with particularly strong performance outside the hyperscale category.
The next product cycle also supports the case. NVIDIA is preparing inventory for Vera Rubin while Blackwell demand remains strong. If supply continues to limit shipments, additional capacity could convert into future revenue rather than excess inventory.
Finally, the China assumption provides a conservative element. The Q3 guide does not require Data Center compute revenue from China, so any future regulatory opening would be incremental rather than necessary to reach the current outlook.
Post-earnings bear case
The bear case begins with expectations. NVIDIA beat consensus, but investors already expect extraordinary growth for years. Even a strong result can disappoint if future upside becomes less certain or requires more capital.
Cash conversion is another concern. Higher receivables and longer payment terms can support customer purchases, yet they also shift more working-capital burden toward NVIDIA. That deserves attention if these arrangements continue expanding.
Finally, NVIDIA’s ecosystem strategy creates new risks. Supply commitments, leases, equity investments, cloud-service purchases, and guarantees can accelerate deployment. However, they also increase exposure to construction delays, customer defaults, underused capacity, and financing conditions.
What to watch before the next quarter
Investors should follow five measurable items:
- Whether the post-earnings gain holds: the next several sessions will show whether buyers defend the August 27 gap and $227.83 close.
- Gross margin: whether the projected move to 74% is temporary or the start of a lower range.
- Cash conversion: accounts receivable, days sales outstanding, operating cash flow, and free cash flow.
- Vera Rubin execution: production timing, customer adoption, inventory, and the mix between chips and complete systems.
- Financing exposure: changes in supply commitments, cloud purchases, leases, guarantees, and equity investments.
China remains relevant, but it is not embedded in the Q3 Data Center compute forecast. Consequently, the cleaner near-term test is whether non-China demand can support the $108 billion target without further pressure on margins or cash flow.
Final earnings verdict
NVIDIA’s Q2 FY2027 operating result was stronger than the initial stock drop suggested. Revenue beat selected expectations by about $4 billion, adjusted EPS beat by roughly 6%, and the Q3 guide exceeded consensus by about 3%.
The completed session delivered the market verdict that the provisional after-hours move could not. NVDA rose 8.7% to $227.83, traded above its pre-earnings close all day, and finished near the high on roughly 2.54 times normal recent volume. Investors clearly placed more weight on the $108 billion outlook, exceptional Data Center growth, and supply-constrained demand than on the projected margin decline.
However, the report also introduced a more complicated NVIDIA: one with exceptional demand and profitability, but much larger commitments to supply, capacity, customer financing, and AI-cloud infrastructure. Therefore, the final conclusion remains two-sided. The demand thesis strengthened decisively, and the market endorsed it—but the balance-sheet and execution thesis became more demanding.
Primary Sources
- NVIDIA Q2 FY2027 financial results
- NVIDIA Q2 FY2027 CFO commentary filed with the SEC
- NVIDIA Form 10-Q for the quarter ended July 26, 2026
- NVIDIA Q1 FY2027 results and prior Q2 guidance
- NVIDIA Q2 FY2027 earnings event
- Nasdaq historical data for NVIDIA common stock
FAQ
Did NVIDIA beat Q2 FY2027 earnings expectations?
Yes. NVIDIA reported $96.221 billion in revenue and $2.22 in adjusted diluted EPS. Those figures were about 4.3% and 6.2% above the selected Wall Street consensus, respectively.
Why did NVDA stock jump 8.7% after earnings?
Investors prioritized NVIDIA’s revenue and adjusted EPS beats, 117% Data Center growth, and a $108 billion Q3 revenue outlook. Lower margin guidance, weaker sequential cash flow, and expanding financial commitments did not outweigh that growth evidence during the completed session.
What was NVIDIA’s Q3 FY2027 revenue guidance?
NVIDIA guided to $108 billion, plus or minus 2%. That equals a range of approximately $105.84 billion to $110.16 billion, with no assumed Data Center compute revenue from China.
How important is Data Center revenue to NVIDIA?
Data Center generated $89.023 billion, or approximately 92.5% of total Q2 revenue. That concentration makes AI-infrastructure demand the primary driver of NVIDIA’s current financial performance.
What is the biggest new risk in NVIDIA’s 10-Q?
The scale of NVIDIA’s infrastructure exposure deserves attention. Supply and capacity commitments reached $279 billion, while separate cloud-service, lease, investment, and guarantee arrangements could increase execution and counterparty risk.
What was NVIDIA’s full-day earnings reaction?
NVDA opened at $222.79 and closed at $227.83, up 8.7% from its $209.66 pre-earnings close. The stock traded between $220.92 and $230.47 on approximately 296.6 million shares, confirming and extending the earlier after-hours reversal.