
Palantir Q2 FY2026 Earnings Report: Can AI Growth Last?
Key Takeaway
Palantir delivered a broad Q2 FY2026 beat, pairing 93% revenue growth with a 62% adjusted operating margin. Management also raised full-year revenue guidance by almost $500 million at the midpoint. The report confirms powerful AI demand, but the next test is sustaining exceptional growth against harder comparisons and elevated investor expectations.
Introduction and immediate market reaction
Palantir reported Q2 FY2026 results after the August 3 regular-session close. Revenue nearly doubled, profitability expanded, and management lifted full-year guidance. The official results covered the quarter ended June 30, 2026.
PLTR closed the August 3 regular session at $125.65. At 4:40 p.m. Eastern, shares traded at $138.11 after hours, up 9.91%. Then, PLTR gained 29.5% during the August 4 regular session.
Educational disclaimer
This article is educational, informational research—not financial advice.
We strive to keep data accurate, but unavoidable errors or omissions may occur. Verify important information with primary sources.
What investors expected before earnings
Selected market consensus called for $1.81 billion in revenue and $0.33 in adjusted EPS. That created a high bar because Palantir shares already reflected strong AI expectations. Investors also wanted evidence that private-sector demand could complement government growth.
The central operating questions involved scale and durability. Investors needed continued U.S. commercial acceleration, strong contract activity, and margin discipline. Meanwhile, any weak guidance could have outweighed a narrow headline beat.
Reported versus expected scoreboard
Palantir cleared both selected consensus benchmarks. Revenue exceeded the estimate by about $125 million, while adjusted EPS beat by $0.08. The year-over-year comparisons also accelerated sharply.
| Metric | Reported | Expected | Surprise | Year-over-year |
|---|---|---|---|---|
| Revenue | $1.935B | $1.810B | +6.9% | +93% |
| Adjusted EPS | $0.41 | $0.33 | +24.2% | +156% |
These figures use one selected consensus source for both estimates. Adjusted EPS rose from $0.16 one year earlier. Therefore, the scoreboard reflects comparable adjusted earnings rather than mixing GAAP and non-GAAP measures.
Revenue segments and AI performance
Growth spread across commercial and government customers. Commercial revenue more than doubled, while government revenue rose 79%. The U.S. commercial business grew fastest at 149%.
| Metric | Q2 FY2026 | Q2 FY2025 | Year-over-year |
|---|---|---|---|
| Total revenue | $1.935B | $1.004B | +93% |
| Commercial revenue | $945M | $451M | +110% |
| Government revenue | $990M | $553M | +79% |
| U.S. commercial revenue | $764M | $306M | +149% |
| U.S. government revenue | $809M | $426M | +90% |
Palantir does not report a standalone AI revenue segment. Consequently, companywide growth and AIP-driven contract activity provide the best available adoption evidence.
Demand indicators reinforced the revenue result. U.S. commercial total contract value reached $2.13 billion, up 153%. In addition, remaining performance obligations reached $4.90 billion, versus $2.42 billion one year ago.
Margins, cash flow, and capital spending
Palantir converted rapid growth into stronger margins and cash flow. GAAP operating margin expanded 20 percentage points, while adjusted operating margin rose 16 points. Cash from operations and adjusted free cash flow both exceeded $1.2 billion.
| Metric | Q2 FY2026 | Q2 FY2025 | Change |
|---|---|---|---|
| GAAP operating margin | 47% | 27% | +20 pts |
| Adjusted operating margin | 62% | 46% | +16 pts |
| Cash from operations | $1.216B | $539M | +126% |
| Adjusted free cash flow | $1.220B | $569M | +115% |
| Property and equipment purchases | $14.6M | $7.6M | +91% |
Capital spending almost doubled, but it stayed small relative to revenue and cash generation. Stock-based compensation increased 66% to $265 million. However, that growth trailed the 93% revenue increase.
Palantir also ended the quarter with $9.2 billion in cash, equivalents, and U.S. Treasury securities. The company reported no debt. That balance sheet offers flexibility as management pursues larger AI deployments.
Updated guidance
Management increased its FY2026 outlook substantially. The new revenue midpoint sits about $498 million above the prior range midpoint. Likewise, the adjusted operating income midpoint increased by roughly $447 million.
| Metric | New guidance | Prior guidance | Change |
|---|---|---|---|
| Q3 FY2026 revenue | $2.160B-$2.164B | Not previously issued | New outlook |
| Q3 adjusted operating income | $1.292B-$1.296B | Not previously issued | New outlook |
| FY2026 revenue | $8.150B-$8.158B | $7.650B-$7.662B | Midpoint +$498M |
| FY2026 U.S. commercial revenue | Above $3.424B; at least +134% | Above $3.224B; at least +120% | Floor +$200M |
| FY2026 adjusted operating income | $4.889B-$4.897B | $4.440B-$4.452B | Midpoint +$447M |
| FY2026 adjusted free cash flow | $4.5B-$4.7B | $4.2B-$4.4B | Midpoint +$300M |
Palantir also expects GAAP operating income and net income in every FY2026 quarter. Moreover, the updated U.S. commercial target implies at least 134% full-year growth.
Management commentary
Management presented the quarter as proof that Palantir can convert AI demand into operating results. The supporting evidence includes faster revenue, larger contracts, higher retention, and wider margins. Net dollar retention reached 157%, while customer count rose 24% to 1,049.
The shareholder message also stressed AI sovereignty. Palantir wants customers to operate AI across sensitive, fragmented, and regulated environments. That positioning matters because it can deepen deployments beyond short experiments.
Still, management enthusiasm should not replace measurement. Contract value can include options or commitments that may not become recognized revenue. Investors should therefore track actual revenue conversion alongside headline deal values.
What improved versus what disappointed
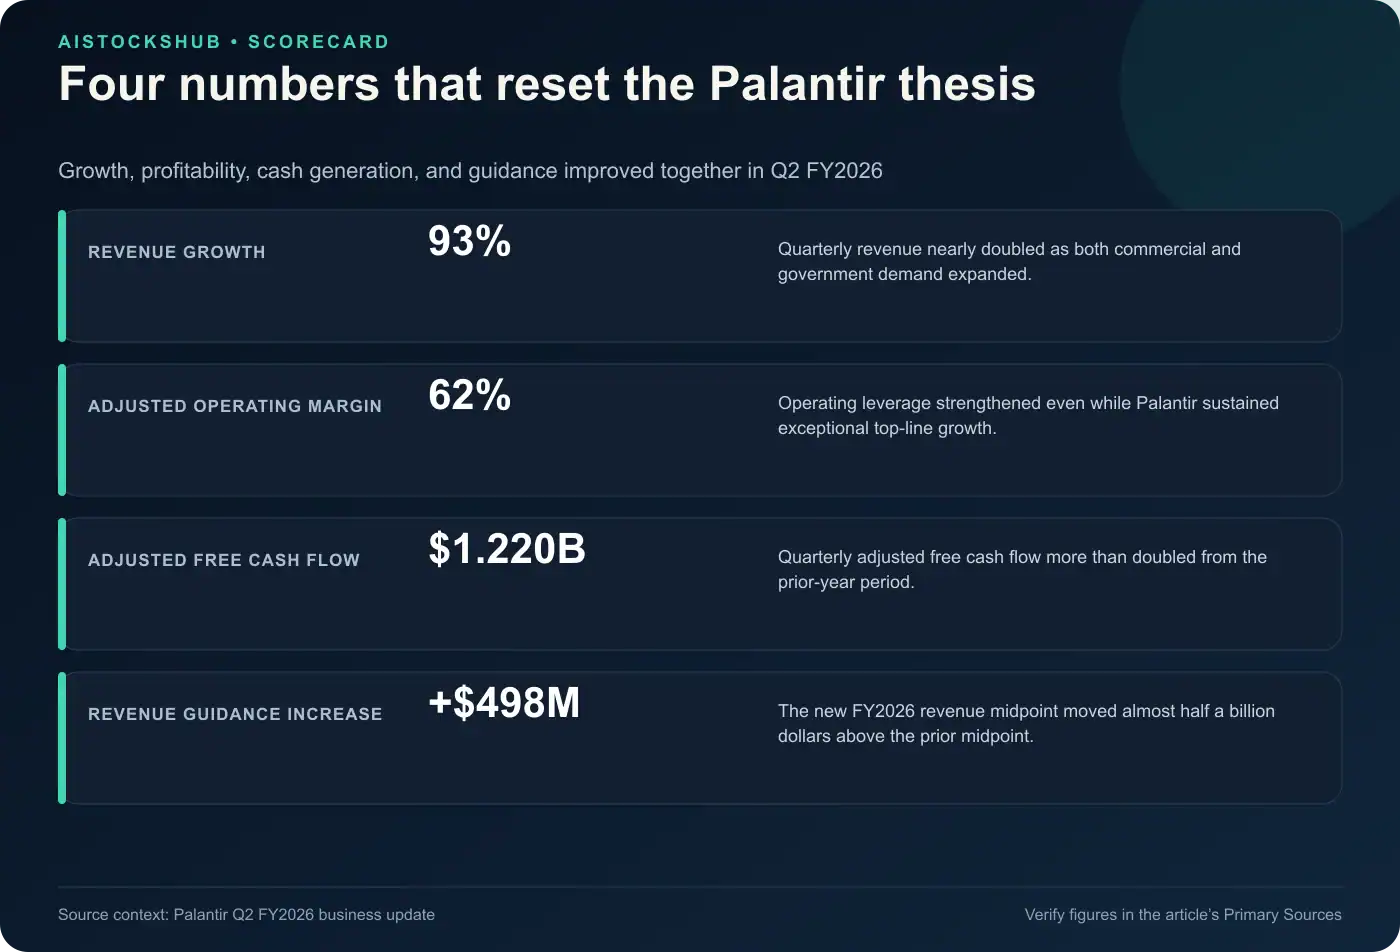
Several measures improved at once. Revenue growth accelerated to 93%, adjusted operating margin reached 62%, and adjusted free cash flow more than doubled. Management then reinforced those results with a much higher full-year outlook.
The quarter offered few conventional disappointments, but risks remain. Stock-based compensation rose to $265 million, capital purchases nearly doubled, and future comparisons became harder. Also, Palantir still does not disclose standalone AI revenue.
That last limitation affects analysis more than reported performance. Investors can observe AIP-related demand through contracts, retention, and segment growth. Nevertheless, they cannot isolate product-level AI revenue from the disclosed figures.
Why the stock moved
The stock moved because the report changed several expectations together. Palantir beat revenue and adjusted EPS estimates, expanded margins, and raised guidance. A narrow beat without higher guidance would likely have produced a weaker response.
Commercial growth supplied another catalyst. U.S. commercial revenue rose 149%, which strengthened the case for broad enterprise adoption. Meanwhile, government revenue still grew 79%, so the commercial gain did not depend on public-sector weakness.
Finally, the profit profile challenged the usual growth-versus-margin tradeoff. Palantir produced a 155% Rule of 40 score by combining 93% growth with a 62% adjusted operating margin. The August 4 regular-session surge suggests investors repriced both growth durability and earnings power.
Before-versus-after investment thesis
Before the release, the central thesis depended on proving that AI enthusiasm could become durable software revenue. Investors also needed confirmation that commercial demand could scale without eroding margins. Guidance carried unusual importance because the share price assumed strong execution.
After the release, monetization looks more tangible. Revenue, contract value, retention, margins, and cash flow all improved together. Furthermore, the increased FY2026 outlook extended the evidence beyond one quarter.
The remaining debate now centers on duration and expectations. Palantir must sustain strong conversion as comparisons tighten. Therefore, the thesis improved operationally even as the market’s performance bar moved higher.
Post-earnings bull case
The bull case starts with breadth. Both commercial and government revenue grew rapidly, and U.S. commercial revenue expanded 149%. That mix suggests Palantir can serve enterprises and governments through the same AI-driven platform strategy.
Profitability strengthens the argument. A 62% adjusted operating margin and $1.22 billion in adjusted free cash flow show powerful operating leverage. Also, $9.2 billion in liquid assets and no debt reduce balance-sheet constraints.
Guidance provides the third pillar. Management raised the full-year revenue midpoint by almost $500 million and lifted the cash-flow outlook. If Palantir converts its contract pipeline, growth could remain exceptional through FY2026.
Post-earnings bear case
The bear case focuses on the new expectations embedded in the stock. A 29.5% next-session gain raises the penalty for future deceleration or guidance misses. Even good results may disappoint if they fall short of a much higher bar.
Quality also requires monitoring. Stock-based compensation increased 66%, and contract-value measures do not guarantee recognized revenue. Additionally, U.S. customers generated roughly 81% of quarterly revenue, creating geographic concentration.
Finally, the growth rate cannot accelerate forever. Q2’s 93% increase creates a challenging future comparison. Investors should distinguish a normal slowdown from evidence that AI demand has weakened.
What to watch before the next quarter
First, compare Q3 revenue with the $2.160 billion to $2.164 billion guidance range. Next, track adjusted operating income against the $1.292 billion to $1.296 billion outlook. These two metrics will test whether growth and margins remain aligned.
Watch U.S. commercial revenue and total contract value for continued enterprise momentum. Also, compare remaining performance obligations with Q2’s $4.90 billion. Those indicators can reveal whether large bookings convert into durable backlog.
Finally, monitor stock-based compensation, adjusted free cash flow, and customer retention. Net dollar retention reached 157% in Q2, so it now carries a demanding benchmark. Any sharp decline could signal slower expansion inside existing customers.
Final earnings verdict
Palantir delivered an exceptional Q2 FY2026. The company beat selected revenue and EPS expectations, expanded margins, generated substantial cash, and raised guidance. Few earnings reports improve that many operating measures at once.
The result also strengthens Palantir’s AI monetization case. However, it does not eliminate valuation, concentration, or execution risk. The most useful next question is whether Palantir can sustain strong conversion as comparisons become harder.
Overall, the evidence supports a stronger operating thesis after earnings. The stock reaction reflects that improvement, but it also increases future expectations. Investors should now prioritize guidance delivery, revenue conversion, and compensation discipline.
Primary Sources
- Palantir Q2 FY2026 earnings release
- Palantir Q2 FY2026 business update
- Palantir Q2 FY2026 shareholder letter
- Palantir Q2 FY2025 SEC-filed earnings release
FAQ
What quarter did Palantir report?
Palantir reported Q2 FY2026 for the quarter ended June 30, 2026. It released results after the August 3 regular-session close.
Did Palantir beat earnings expectations?
Yes. Revenue of $1.935 billion beat selected consensus of $1.810 billion, while adjusted EPS of $0.41 beat $0.33.
What drove Palantir’s growth?
Both customer groups contributed. Commercial revenue rose 110%, government revenue grew 79%, and U.S. commercial revenue increased 149%.
What is Palantir’s new FY2026 revenue guidance?
Management expects $8.150 billion to $8.158 billion. The prior range was $7.650 billion to $7.662 billion.
What matters most next quarter?
Q3 revenue, adjusted operating income, U.S. commercial growth, contract conversion, and net dollar retention are the clearest checkpoints.