AMD vs NVIDIA: AI Growth, Earnings Power, and How to Invest with Limited Risk
Artificial intelligence has transformed the semiconductor industry into one of the most critical segments of the global economy. At the center of this transformation are two companies: NVIDIA and Advanced Micro Devices.
While both companies are positioned to benefit from the AI boom, their roles, scale, and financial performance differ significantly. For investors, the decision is not simply which company is better, but how to approach investing in these stocks given their volatility and sensitivity to expectations.
Disclaimer: This article is for informational purposes only and does not constitute financial advice. Always conduct your own research before making investment decisions.
Business Overview and AI Positioning
NVIDIA has evolved into a pure AI infrastructure company, with its data center segment dominating revenue. Its CUDA ecosystem and full-stack AI platform give it a significant competitive moat.
AMD, in contrast, operates a more diversified model. While its data center business is growing rapidly, it still derives revenue from client computing, gaming, and embedded systems. This diversification provides stability but also dilutes its AI concentration.
👉 Key distinction:
AMD → AI challenger with diversified growth
NVIDIA → AI-first, platform-driven dominance
Financial Performance: Exponential Scale vs Gradual Expansion
The divergence in revenue growth reflects fundamentally different positions in the AI value chain.
Revenue Comparison (Last 3 Years)
| Year | NVIDIA | AMD |
|---|---|---|
| 2023 | ~$27B | ~$23B |
| 2024 | ~$60B+ | ~$26B |
| 2025 | ~$130.5B | ~$34.6B |
NVIDIA’s explosive growth is driven almost entirely by data center and AI infrastructure demand, particularly from hyperscalers building large-scale AI systems. Its GPUs have become the default standard for training and deploying AI models.
AMD, by contrast, is still transitioning into this space. While its data center business is growing, it remains one component of a broader portfolio, including client computing and gaming.
Net Income Comparison (Last 3 Years)
Over the past three years, the gap in net income between NVIDIA and AMD has widened significantly, reflecting not just differences in scale but also in business economics. NVIDIA’s profitability has expanded at an exceptional pace, driven by strong pricing power, high demand for its AI GPUs, and a tightly integrated software ecosystem that allows it to capture more value per unit sold.
| Year | NVIDIA | AMD |
|---|---|---|
| 2023 | ~$4–5B | ~$1–2B |
| 2024 | ~$29–30B | ~$2–3B |
| 2025 | ~$70B+ | ~$4.3B |
AMD, while demonstrating steady improvement in profitability, operates in a more competitive environment with lower margins and a more diversified revenue base. Its growth in net income reflects gradual scaling of its data center and AI segments, but it has not yet reached the level of operating leverage seen in NVIDIA’s business.
In essence, NVIDIA’s net income growth highlights dominance and margin expansion, while AMD’s reflects progressive improvement as it scales its AI presence.
Operating Cash Flow Comparison (Last 3 Years)
Operating cash flow highlights how effectively a company converts its earnings into real cash, and over the past three years, NVIDIA has demonstrated a dramatic expansion in this area. Its surge in cash flow is closely tied to explosive revenue growth in AI infrastructure, combined with strong margins and efficient working capital management, allowing a significant portion of earnings to translate directly into cash.
| Year | NVIDIA | AMD |
|---|---|---|
| 2023 | ~$5–6B | ~$3–4B |
| 2024 | ~$40B+ | ~$4–5B |
| 2025 | ~$90B+ | ~$6–7B |
AMD, in contrast, has shown steady but more measured growth in operating cash flow. While its cash generation has improved alongside rising data center revenues, it remains constrained by comparatively lower margins and a broader business mix that includes less cash-efficient segments.
Overall, NVIDIA’s operating cash flow reflects exceptional cash conversion and financial strength, enabling aggressive reinvestment and scale, whereas AMD’s trajectory indicates gradual improvement as its AI-driven business expands.
EPS Comparison (Last 3 Years)
Earnings per share provides a clearer view of how profit growth translates to shareholder value, and over the past three years, both NVIDIA and AMD have shown meaningful improvement, though at very different scales and trajectories. NVIDIA’s EPS growth accelerated rapidly alongside its surge in AI-driven revenue and margins, reflecting strong operating leverage and efficient cost structure.
| Year | NVIDIA | AMD |
|---|---|---|
| 2023 | ~$1.5 | ~$1.0 |
| 2024 | ~$3.0+ | ~$1.5–2.0 |
| 2025 | ~$2.9–3.0 | ~$2.65 |
AMD’s EPS growth, while positive, has been more gradual, tracking its steady expansion in data center and AI segments. The company is improving profitability, but its broader business mix and lower margins limit the pace at which earnings scale on a per-share basis.
In essence, NVIDIA’s EPS reflects rapid scaling of high-margin AI earnings, while AMD’s EPS reflects consistent but incremental improvement as its AI business matures.
P/E Ratio: Valuation vs Growth Expectations
When looking at valuation, the P/E ratio can be viewed in two ways. The trailing P/E reflects how the market values the company based on its recent earnings, while the forward P/E reflects what investors expect the company to earn in the future. Together, they provide a sense of both current profitability and future expectations.
| Metric | NVIDIA | AMD |
|---|---|---|
| Trailing P/E | ~35–45x | ~40–55x |
| Forward P/E | ~22–25x | ~30–35x |
Despite NVIDIA’s absolute dominance in AI, it currently trades at a lower forward multiple than AMD. This suggests that NVIDIA’s massive growth is already “derisked” and supported by proven, massive earnings power. In contrast, AMD’s higher multiple reflects a “Safety Valve” premium. Hyperscalers (Microsoft, Meta, Google) are desperate for a viable alternative to NVIDIA’s closed ecosystem to keep pricing competitive.
Investors are paying more for AMD today because they are betting on the industry forcing a multi-polar market where AMD gains share as a strategic necessity. Furthermore, as the market shifts from “training” AI models to “inference” (running them), AMD’s price-to-performance ratio in the MI350/MI400 series provides a valuation floor that NVIDIA’s pure-infrastructure play lacks.
In essence, NVIDIA’s valuation is anchored in proven earnings power, while AMD’s reflects future growth expectations.
Analyst Outlook: Price Targets
Analyst price targets provide a forward-looking view of how the market expects each company to perform, based on projected earnings, growth, and competitive positioning. These targets typically include low, average, and high estimates, reflecting both consensus expectations and uncertainty.
| Metric | NVIDIA | AMD |
|---|---|---|
| Current Price (as of 3rd April, 2026) | $177.39 | $214.43 |
| Low Target | ~$200–$220 | ~$220 |
| Average Target | ~$260–$275 | ~$285–$300 |
| High Target | ~$350–$380 | ~$350–$365 |
Analyst sentiment for both NVIDIA and AMD remains strongly positive, but the nature of that optimism differs in important ways.
For NVIDIA, price targets reflect confidence in continued dominance of the AI infrastructure market. The relatively tight clustering of estimates suggests that analysts largely agree on the company’s growth trajectory, with average targets implying roughly 40–55% upside from current levels.
For Advanced Micro Devices, the range of price targets is broader, indicating greater uncertainty around execution. While the average target also implies meaningful upside (around 40%+), the wider spread reflects differing views on how quickly AMD can gain market share in AI accelerators.
| Rating | NVIDIA | AMD |
|---|---|---|
| Buy / Strong Buy | Majority (40+ analysts) | Majority (30+ analysts) |
| Hold | Very few | Moderate |
| Sell | Rare | Rare |
Strategic Positioning: Contracts, Market Share, and Ecosystem
While financial performance highlights what these companies have achieved, their strategic positioning provides insight into how they are likely to evolve within the AI ecosystem. The differences between NVIDIA and AMD become clearer when comparing their contracts, market share, and ecosystem strength side by side.
| Category | NVIDIA | AMD |
|---|---|---|
| Major Contracts | Broad, multi-year deals across hyperscalers (Microsoft, Amazon, Google, Meta) | Large, targeted contracts (Meta, OpenAI) |
| Contract Strategy | Ecosystem-wide deployment across multiple customers | Focused, high-value deals to gain share |
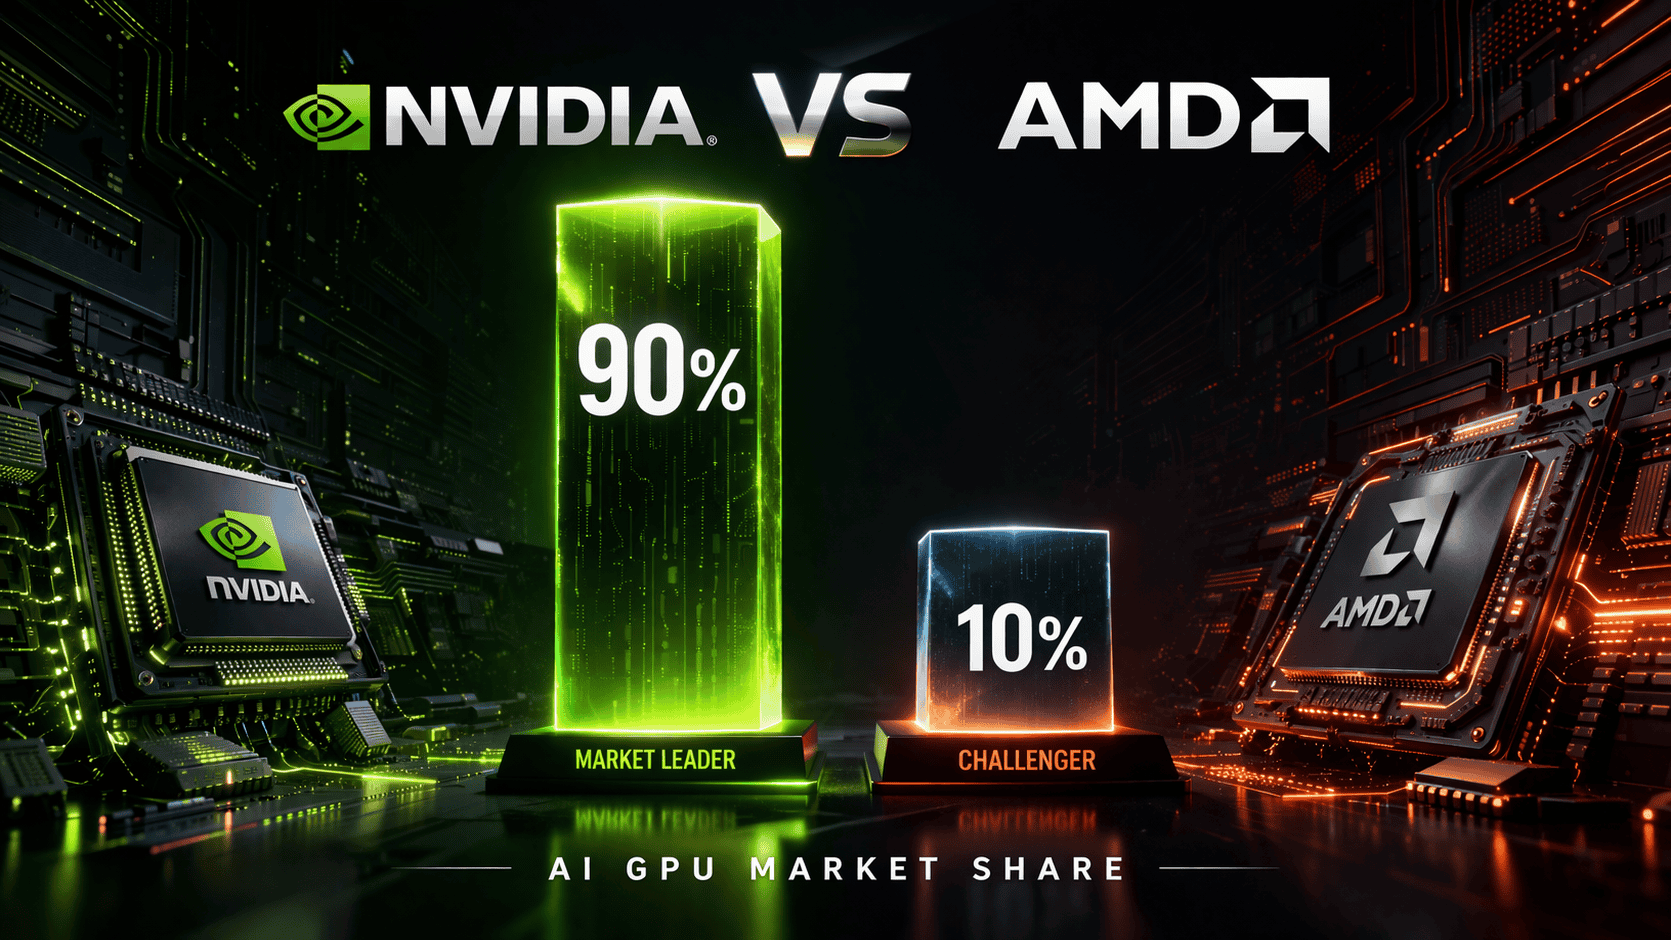
| AI GPU Market Share | ~80–90% (dominant position) | ~10% (growing presence) |
| Ecosystem | CUDA (mature, industry standard, strong lock-in) | ROCm (open, growing but less adopted) |
| Product Approach | Full-stack platform (hardware + software + networking) | Primarily hardware-led with improving software stack |
| Customer Base | Highly diversified across hyperscalers and enterprises | More concentrated, driven by large contracts |
| Competitive Position | Market leader with strong pricing power | Challenger competing on performance and cost |
NVIDIA’s strength lies in its broad ecosystem dominance, where its technology is deeply embedded across the AI infrastructure landscape. This allows it to scale consistently across multiple customers while maintaining strong pricing power.
AMD, by contrast, is building its position through targeted, high-impact partnerships, using large contracts to establish credibility and expand its presence in AI infrastructure. While this approach creates meaningful growth opportunities, it also reflects a more concentrated and execution-dependent strategy.
In essence, NVIDIA scales through ecosystem dominance,while AMD expands through strategic contracts and incremental market share gains.