ARM Unusual Options Alert: A 74x Volume-to-OI Call Sweep Signals Bullish Bets Into Q1 FY27 Earnings
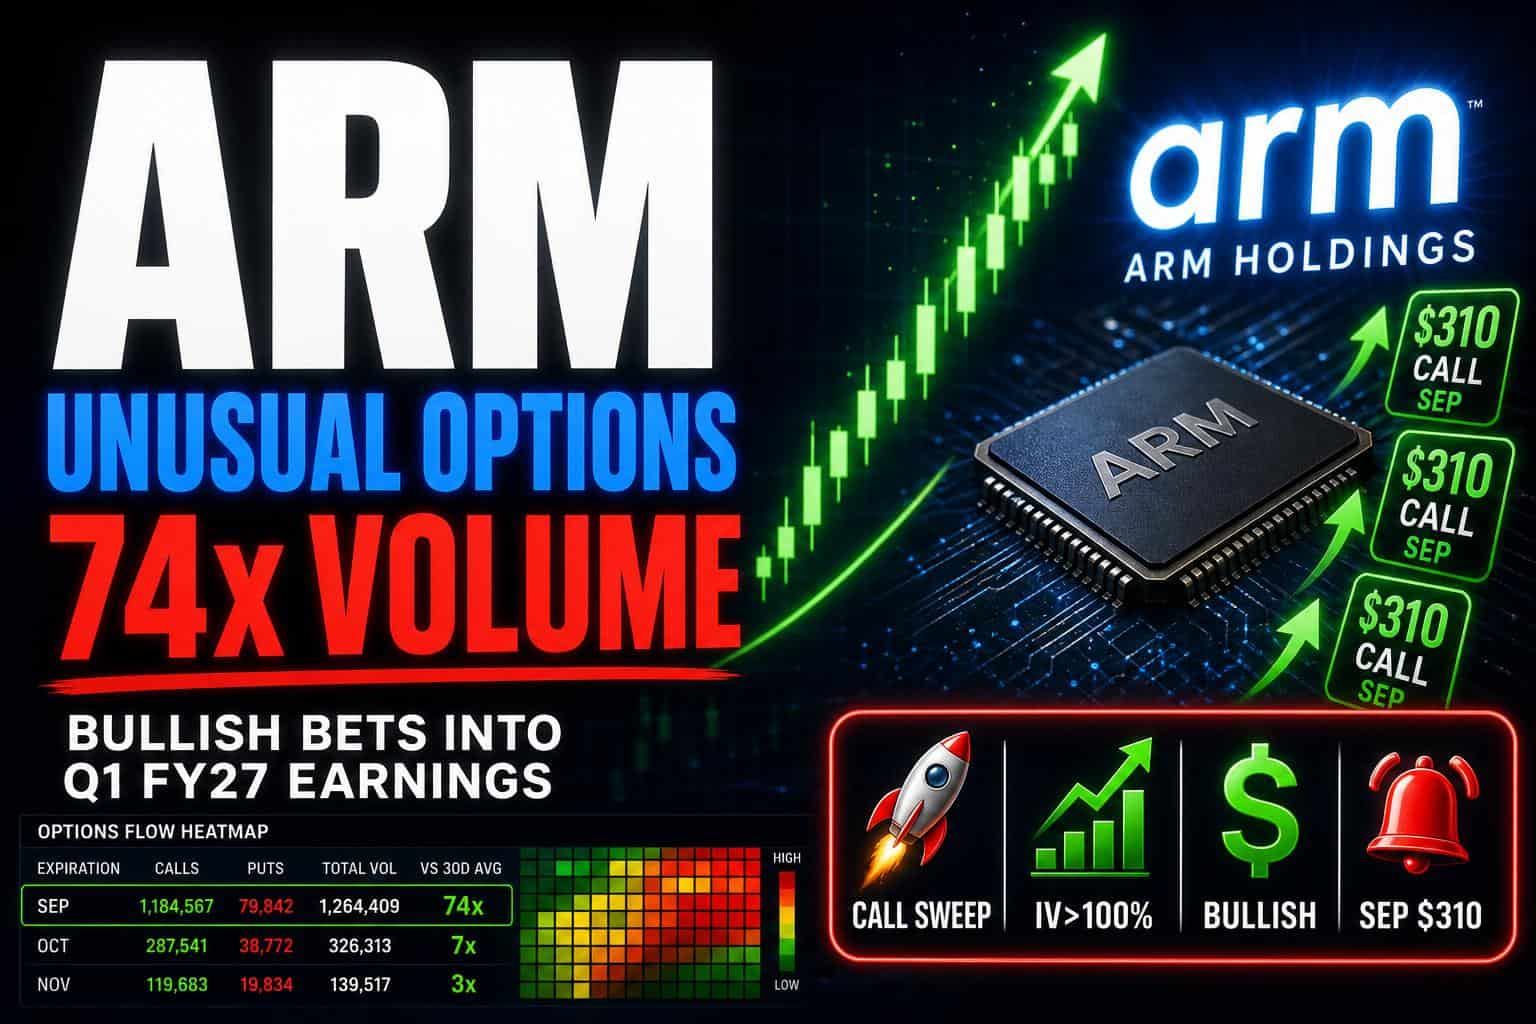
On July 10, 2026, a wave of aggressive call buying hit Arm Holdings (NASDAQ: ARM) that’s hard to ignore. The standout print: the September 18 $310 calls traded 12,537 contracts against just 168 in open interest — a volume-to-open-interest ratio of roughly 74x. When a single strike trades that far above its resting position, it almost always means new money, not existing traders closing out.
ARM closed the session near $323.39, meaning those calls were already in the money. Paired with matching activity at the $300 and $320 strikes, the pattern looks less like a hedge and more like a directional bet ahead of ARM’s Q1 fiscal 2027 earnings, expected in late July.
On July 10, 2026, an ARM call sweep across the Sep $300, $310, and $320 strikes traded at 3x–75x open interest with IV above 100%. It’s an aggressive bullish setup into late-July earnings — and the elevated IV is the price of admission.
What the Unusual Options Print Actually Shows
Here are the five most unusual ARM contracts from the July 10 session, straight from the flow data:
- Sep 18 $310 Call — Volume 12,537 · OI 168 · Vol/OI 74.6x · Delta 0.63
- Sep 18 $300 Call — Volume 9,060 · OI 839 · Vol/OI 10.8x · Delta 0.66
- Jul 17 $345 Call — Volume 1,479 · OI 162 · Vol/OI 9.1x · Delta 0.33
- Jul 17 $335 Call — Volume 1,516 · OI 394 · Vol/OI 3.9x · Delta 0.42
- Sep 18 $320 Call — Volume 753 · OI 288 · Vol/OI 2.6x · Delta 0.60
Every one of the top-five prints was a call. There are no matching puts in the alert set. That one-sided flow is the first tell that this is directional positioning, not a delta-neutral hedge.
Disclaimer: This article is for informational purposes only and does not constitute financial advice. Always conduct your own research before making investment decisions.
Why Vol/OI Matters
Open interest is the number of contracts sitting on the books before the session starts. When a strike trades many multiples of that overnight, most of the volume must be opening new positions. A 74x ratio at a single strike is exceptional — you typically only see that when a large player is deliberately building a position in a hurry.
Two of the September strikes (300 and 310) had deltas of roughly 0.63–0.66, which means the buyer wasn’t reaching for a lottery ticket — they were buying already in-the-money calls that behave a lot like leveraged stock. That’s what a conviction bet looks like.
The Setup: Why ARM, Why Now?
ARM has been one of the most contested AI-adjacent names of 2026. The stock’s 52-week range is roughly $100 to $453, and it currently sits around $323 — well off the highs but comfortably above where it started the year.
Three narratives are converging right now:
- AGI CPU demand — ARM’s designs are showing up in more AI training and inference systems, and management has publicly flagged that demand is outrunning what customers can currently deploy.
- Late-July earnings catalyst — Q1 FY27 results are expected in the back half of July. The Sep expiry captures the print plus roughly six weeks of follow-through.
- Rebound in AI semis — after a mid-summer drawdown across the AI-chip complex, money has been rotating back into the group. ARM has traded up multiple double-digit sessions in the past two weeks.
A trader positioning for a beat-and-raise into that setup would do exactly what the tape showed: buy near-the-money and slightly in-the-money September calls in size.
Reading the Implied Volatility
Every one of the unusual prints came with implied volatility above 100%. That is not normal — even for a high-beta AI name. Options markets are pricing in the possibility of a very large post-earnings move in either direction.
The practical translation: these calls are expensive. A buyer paying ~$63 for the Sep $310 call needs ARM to be above roughly $373 by expiration just to break even at exercise — that’s about a 15% move in ~10 weeks. It’s a bullish bet, but the entry price already assumes something has to happen.
What Would Confirm the Thesis
- Follow-on call buying at the same strikes over the next several sessions
- Rising open interest on July 11 and after (confirming the volume was net new positions, not day trades)
- Continued call skew — puts staying quiet relative to calls
- ARM holding above $310 into the earnings print
What Would Invalidate It
- Matching put volume showing up — that would suggest the calls are one leg of a spread, not a directional bet
- OI falling on July 11 despite the huge volume — a sign the trades were closed intraday
- A break below the $300 strike before earnings
How to Think About Trading Around This
Unusual options activity is a signal, not a trade recommendation. A few honest reminders before you act on it:
- You do not know who’s on the other side. A hedge fund with a $50M position isn’t the same trader as a retail account, and the two have different risk tolerances. Copying the trade blindly is not the same as understanding it.
- Options are decaying assets. Even if the direction is right, IV crush after earnings can destroy premium on both sides of the trade. Long calls into an earnings print are a leveraged bet on both direction and magnitude.
- Size for the volatility. With IV above 100%, position sizing matters more than usual — a full-conviction stake here is a fraction of what it would be in a low-IV name.
- Consider expressing the view differently. A vertical call spread (buy the $310, sell the $340) caps the payoff but massively cuts the premium and IV exposure. It’s often a cleaner way to trade an earnings catalyst.
The Bottom Line
The ARM options tape on July 10 was unambiguous: someone with size is positioning bullishly into the Q1 FY27 print, at strikes that pay off if ARM breaks above the mid-$370s by mid-September.
That doesn’t guarantee they’re right. But when a 74x Vol/OI print shows up at a single strike, alongside supporting flow at adjacent strikes and no matching put activity, it belongs on your radar — either as a trade idea to size carefully, or as a warning to check your own downside exposure into a very binary earnings event.
Frequently Asked Questions
What does a high volume-to-open-interest ratio mean?
It means most of the day’s trading volume in that contract is opening new positions rather than closing existing ones. Ratios above ~3x are notable; anything above 10x is genuinely unusual and typically reflects a deliberate, size-driven bet.
Does unusual call activity always mean the stock will go up?
No. Institutions buy calls for many reasons — outright directional bets, hedges against short positions, or the long leg of a spread. It’s a signal to investigate, not a signal to blindly buy.
Why is ARM’s implied volatility so high?
ARM reports Q1 FY27 earnings in late July, and options markets always price in a wider expected move around earnings. High IV means options are expensive, and any premium buyer needs a large move just to break even.
Is buying ARM calls after this flow a good idea?
It’s not a copy-trade. IV above 100% means you’d be paying a much higher premium than the original buyer, with less time to be right. A defined-risk spread or a smaller share position is usually a more sensible way to express the same view.