Broadcom Inc. AVGO Q3 FY2026 Earnings: Why Stock Fell 2.7%
Key Takeaway
Broadcom converted its most important August forecast into a reported result. Fiscal Q3 AI semiconductor revenue reached $16.7 billion, above management’s prior $16.0 billion target, while total revenue climbed 86% year over year to $29.591 billion. Free cash flow nearly doubled to $13.665 billion.
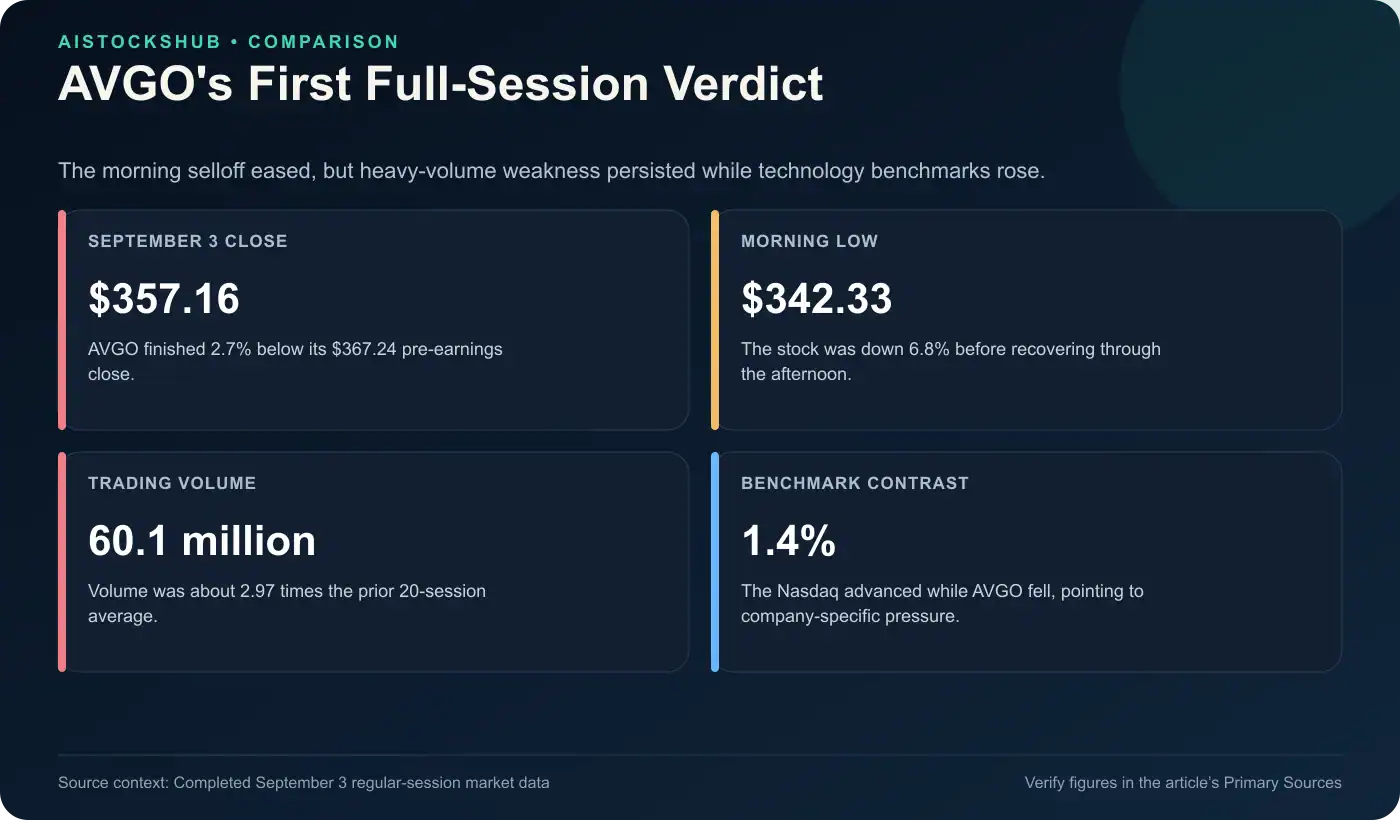
However, the first full trading session exposed a demanding expectations bar. AVGO closed September 3 at $357.16, down 2.7% from its $367.24 pre-earnings close. Shares opened at $351.61, fell to $342.33, and then recovered into the close on 60.1 million shares—about three times the prior 20-session average. Because the Nasdaq Composite rose 1.4% and the iShares Semiconductor ETF gained 0.2%, the decline was company-specific rather than a broad technology selloff.
Introduction and immediate market reaction
Broadcom reported fiscal Q3 FY2026 results after the market closed on September 2, 2026. The quarter ended August 2. This report is a direct follow-up to our August 1 Broadcom stock report, which identified one immediate test: whether the company could turn its $16.0 billion Q3 AI semiconductor forecast into reported revenue. Readers can find the latest company coverage and key figures on the Broadcom AVGO stock hub.
Broadcom passed that test with $16.7 billion. Nevertheless, the completed September 3 reaction was negative because investors were also evaluating the size of the beat and the Q4 outlook. AVGO opened at $351.61, a 4.3% gap below the pre-earnings close. It reached a session low of $342.33 at approximately 10:47 a.m. ET, down 6.8%, before recovering through the afternoon to close at $357.16.
The closing decline was smaller than the morning selloff, but it was still decisive. AVGO underperformed the semiconductor benchmark by about 2.9 percentage points and the Nasdaq Composite by about 4.1 points. Moreover, the 60.1 million-share volume was approximately 2.97 times its prior 20-session average of 20.2 million. Those comparisons are AIStocksHub calculations from completed regular-session data.
Educational disclaimer
This article is educational, informational research—not financial advice.
We strive to keep data accurate, but unavoidable errors or omissions may occur. Verify important information with primary sources.
What investors expected before earnings
The market expected rapid growth before Broadcom reported. A selected Wall Street consensus called for approximately $29.45 billion in revenue and $3.23 in adjusted diluted earnings per share. The same expectation set placed AI semiconductor revenue near $15.93 billion.
The larger challenge was guidance. Investors were looking for roughly $35.05 billion of Q4 revenue, so Broadcom needed more than a routine beat. It also needed an outlook strong enough to support expectations that custom accelerators and AI networking would keep expanding at an exceptional rate.
Broadcom’s own prior targets created a second benchmark. In June, management guided to about $29.4 billion of Q3 total revenue and $16.0 billion of Q3 AI semiconductor revenue. The reported quarter exceeded both figures, although by different margins.
Reported versus expected scoreboard
| Metric | Reported | Expected | Surprise | Year-over-year |
|---|---|---|---|---|
| Revenue | $29.591B | $29.45B | +$0.141B, or about 0.5% | +86% |
| Adjusted diluted EPS | $3.32 | $3.23 | +$0.09, or about 2.8% | +96% |
The earnings beat was real but modest relative to the scale of expectations. In contrast, AI semiconductor revenue exceeded the selected $15.93 billion expectation by approximately $0.77 billion, or 4.8%. It also finished $0.7 billion above Broadcom’s own $16.0 billion forecast. These percentage comparisons are AIStocksHub calculations.
Revenue segments and AI performance
AI became the main force behind Broadcom’s semiconductor expansion. Semiconductor Solutions revenue more than doubled, while Infrastructure Software also accelerated from its fiscal Q2 growth rate. The resulting mix shifted much more heavily toward semiconductors.
| Revenue category | Q3 FY2026 | Q3 FY2025 | Year-over-year change |
|---|---|---|---|
| Semiconductor Solutions | $20.839B | $9.166B | +127% |
| Infrastructure Software | $8.752B | $6.786B | +29% |
| AI semiconductor revenue | $16.7B | $5.2B | +221% |
| Total revenue | $29.591B | $15.952B | +86% |
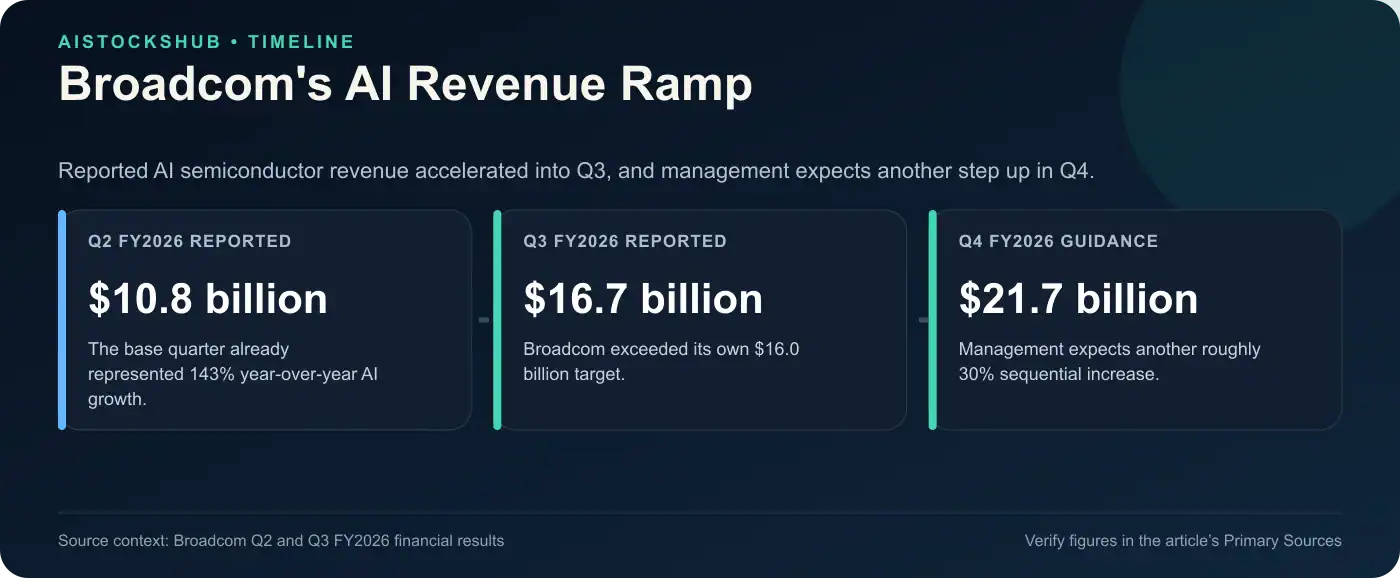
AI semiconductor revenue increased 54% sequentially from $10.8 billion in fiscal Q2. In addition, it represented approximately 56.4% of total Q3 revenue and roughly 80.1% of Semiconductor Solutions revenue. Those mix percentages are AIStocksHub calculations, because Broadcom reports AI semiconductor revenue as a management metric rather than a separate audited segment.
Infrastructure Software supplied an important counterweight. Its $8.752 billion contribution was smaller than semiconductor revenue, but 29% growth strengthened the argument that Broadcom retains a meaningful second engine beyond custom AI silicon.
Margins, cash flow, and capital spending
Broadcom paired its revenue surge with substantial operating leverage. GAAP operating income rose 171%, while non-GAAP operating income increased 92%. Meanwhile, free cash flow reached 46% of revenue.
| Operating metric | Q3 FY2026 | Q3 FY2025 | Change |
|---|---|---|---|
| GAAP operating income | $15.955B | $5.887B | +171% |
| Non-GAAP operating income | $20.095B | $10.455B | +92% |
| Cash from operations | $14.197B | $7.166B | +98% |
| Capital expenditures | $0.532B | $0.142B | +$0.390B |
| Free cash flow | $13.665B | $7.024B | +95% |
| Free-cash-flow margin | 46% | 44% | +2 percentage points |
The capital-expenditure values follow Broadcom’s definition of free cash flow as operating cash flow minus capital expenditures. Although capital spending increased, it remained small relative to operating cash generation. Broadcom also ended the quarter with $24.0 billion in cash and cash equivalents, up from $19.6 billion at the end of fiscal Q2.
Updated guidance
Management expects AI momentum to accelerate again in fiscal Q4. Still, the consolidated revenue midpoint did not clear the selected Wall Street expectation.
| Q4 FY2026 item | Broadcom guidance | Comparison |
|---|---|---|
| Total revenue | Approximately $34.8B | +93% YoY; about 0.7% below selected $35.05B consensus |
| AI semiconductor revenue | Approximately $21.7B | +236% YoY; about 30% above Q3 |
| Non-GAAP operating income margin | Approximately 66% | Flat from the year-ago period |
If Broadcom reaches the $21.7 billion AI target, AI semiconductor revenue would equal roughly 62.4% of projected total Q4 revenue. That mix calculation shows why AVGO’s near-term thesis has become increasingly dependent on custom accelerators and networking execution.
Market expectations
Sell-side expectations remained very optimistic before the release. One selected provider’s publicly aggregated analyst snapshot, as of August 31, showed 45 Buy or Strong Buy ratings, four Hold ratings, and no Sell ratings.
| Analyst snapshot | Count |
|---|---|
| Buy or Strong Buy | 45 |
| Hold | 4 |
| Sell or Strong Sell | 0 |
The same provider’s price targets spanned a wide range. Relative to AVGO’s current share price represented by the September 2 regular-session close, the average target implied substantial upside, while the lowest target implied meaningful downside.
| Price comparison | Value | Versus $367.24 close |
|---|---|---|
| Pre-earnings share price: September 2 close | $367.24 | Baseline |
| Post-earnings share price: September 3 close | $357.16 | -2.7% |
| Average analyst target | $525.97 | +47.3% versus September 3 close |
| Highest analyst target | $675.00 | +89.0% versus September 3 close |
| Lowest analyst target | $215.88 | -39.6% versus September 3 close |
These are changing third-party estimates, not Broadcom guidance, facts reported by the company, or investment instructions. More importantly, the wide range illustrates how differently analysts can value the durability of AI growth, customer concentration, margins, and execution risk.
Management commentary
Chief Executive Officer Hock Tan said demand for Broadcom’s custom AI accelerators and networking remained very strong. Management also presented the Q4 AI forecast as an acceleration rather than a one-time peak.
Chief Financial Officer Amie Thuener emphasized record revenue, operating profit, and free cash flow. She also said Broadcom expects to maintain a 66% non-GAAP operating margin in Q4. Together, those statements frame the management case: exceptional AI demand is scaling without destroying operating profitability.
However, the release did not resolve every risk raised in August. As of the September 3 post-close review, Broadcom had filed its earnings Form 8-K but not its fiscal Q3 Form 10-Q. Therefore, a fresh concentration, debt, and contractual-risk review remains pending. In addition, the earnings release did not disclose customer-level AI revenue, program margins, unit volumes, or purchase commitments.
What improved versus what disappointed
Three areas improved materially:
- Broadcom converted its $16.0 billion Q3 AI forecast into $16.7 billion of reported revenue.
- AI semiconductor growth accelerated to 221% year over year and 54% sequentially.
- Free cash flow increased 95% to $13.665 billion while its margin rose to 46%.
Nevertheless, three points kept the result from being an uncomplicated victory:
- Total revenue and adjusted EPS beat the selected consensus by only about 0.5% and 2.8%, respectively.
- The $34.8 billion Q4 revenue outlook was approximately $250 million below the selected consensus.
- The business mix is becoming more dependent on AI semiconductor execution, while customer-level economics remain undisclosed.
Why the stock moved
The full-day decline most likely reflected the gap between excellent reported growth and even higher embedded expectations. Broadcom exceeded both revenue and adjusted EPS estimates, yet the beats were modest. Moreover, its $34.8 billion Q4 revenue forecast missed the selected consensus by roughly 0.7%.
The intraday recovery shows that investors did not dismiss the AI details. Q3 AI semiconductor revenue beat both Broadcom’s own target and the selected expectation, while the Q4 AI forecast pointed to another 30% sequential increase. From the $342.33 morning low, AVGO rebounded 4.3% by the close and finished only 0.6% below its $359.40 session high.
Even so, the completed close settled the conflict more clearly than the volatile after-hours session. Investors rewarded neither the 221% AI growth nor the $13.665 billion of free cash flow enough to erase the guidance concern. The heavy volume and sharp underperformance versus rising technology benchmarks indicate that the market treated the Q4 expectation gap as Broadcom-specific.
Before-versus-after earnings thesis
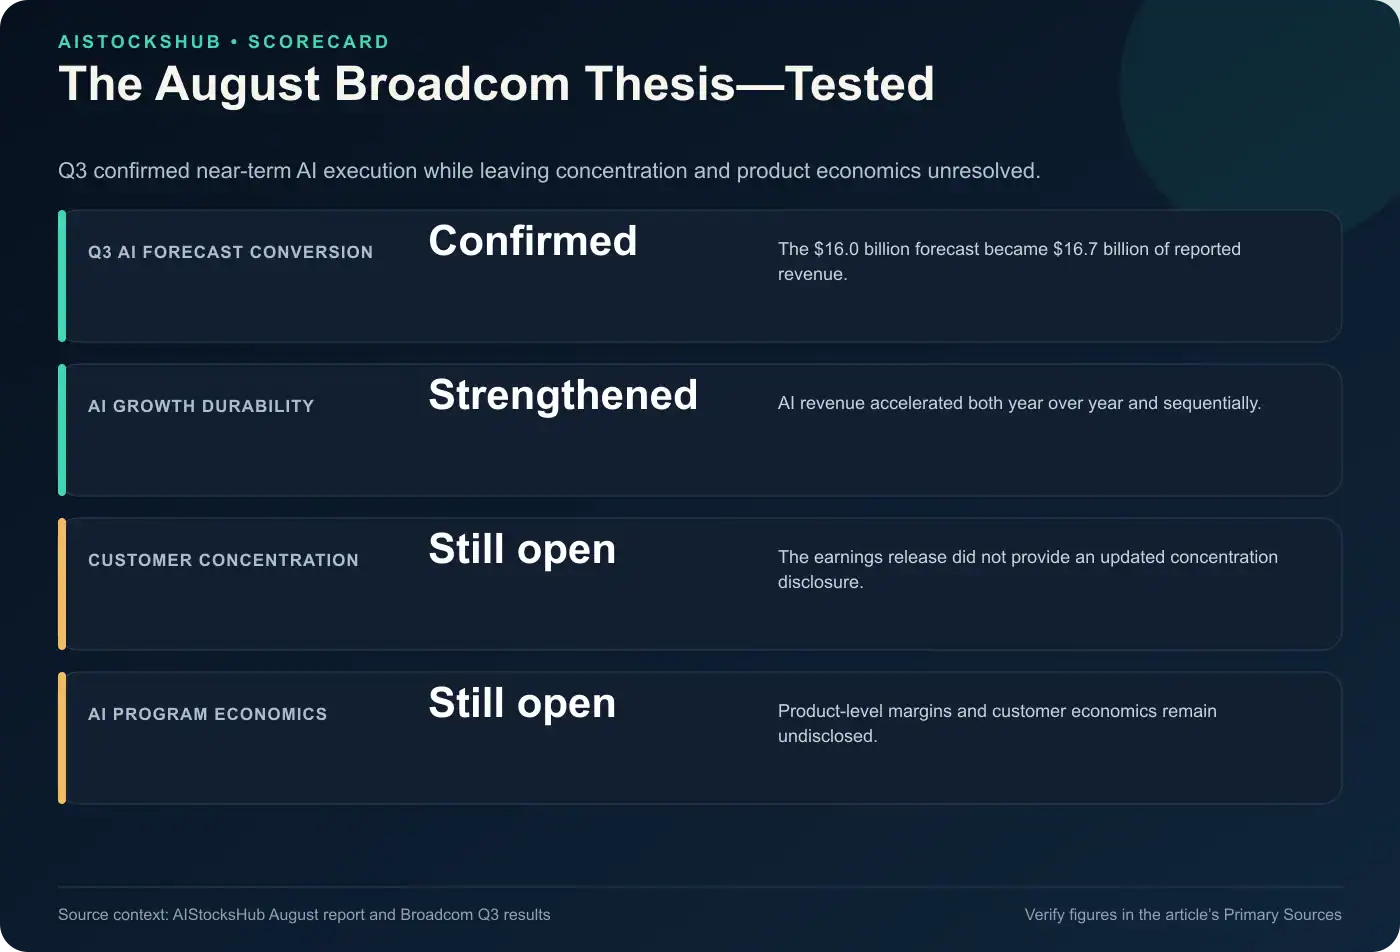
The August 1 report argued that Broadcom’s key challenge was durability: could it convert large customer programs and guidance into recurring, profitable revenue while managing concentration, leverage, and margin risk? Fiscal Q3 answered part of that question, but not all of it.
| August thesis point | What Q3 showed | Current assessment |
|---|---|---|
| $16.0B Q3 AI forecast still had to become reported revenue | Broadcom reported $16.7B | Confirmed |
| AI growth depended on custom accelerators and networking execution | AI semiconductor revenue rose 221% YoY and 54% QoQ | Strengthened |
| Software could provide diversification | Infrastructure Software grew 29% to $8.752B | Improved |
| Strong cash generation could offset financial risk | Free cash flow rose 95% to $13.665B | Strengthened |
| Customer concentration could magnify deployment changes | No updated Q3 concentration disclosure yet | Still open |
| AI systems and mix could pressure margins | Q4 non-GAAP operating margin guide is 66%; product-level economics remain undisclosed | Still open |
This is the most important connection between the two articles. The earlier report did not merely predict that AI revenue would rise; it identified conversion of the $16 billion forecast as a test. Broadcom exceeded that figure. Meanwhile, the report’s warnings about concentration, disclosure limits, and margin mix remain relevant rather than disproven.
Post-earnings bull case
The bull case strengthened because Broadcom demonstrated acceleration across scale, not just a small-base comparison. Total revenue reached $29.591 billion, and AI semiconductor revenue grew from $10.8 billion in Q2 to $16.7 billion in Q3. Management now expects another increase to $21.7 billion in Q4.
Cash generation also supports the case. Broadcom produced $13.665 billion of free cash flow while keeping capital expenditures at $0.532 billion. Consequently, the company has significant internally generated resources to support research, supply commitments, debt service, dividends, and strategic flexibility.
Finally, the software business improved. Infrastructure Software’s 29% growth does not match the AI surge, but it provides scale and diversification that a pure-play chip supplier would not have.
Post-earnings bear case
The bear case starts with the expectations gap. Revenue growth of 86% is extraordinary, yet the stock initially sold off because investors wanted a larger beat and stronger total Q4 guidance. That response shows how little room for disappointment may remain.
Concentration risk also persists. The prior fiscal Q2 filing said one distributor represented 42% of revenue and the five largest end customers represented approximately 45%. The Q3 earnings release did not update those figures. Until the new 10-Q arrives, investors cannot determine whether the latest AI acceleration broadened or further concentrated the revenue base.
Finally, AI is becoming a larger share of the company. That can increase growth, but it also raises exposure to customer deployment timing, competing architectures, advanced-packaging capacity, supply constraints, and undisclosed program economics.
What to watch before the next quarter
Investors should follow five measurable checkpoints:
- The fiscal Q3 Form 10-Q: updated customer concentration, debt, commitments, inventory, receivables, and risk disclosures.
- Q4 AI revenue conversion: whether Broadcom can turn the $21.7 billion forecast into reported sales.
- Operating margin: whether the approximately 66% non-GAAP Q4 guide holds as AI becomes a larger part of the mix.
- Infrastructure Software growth: whether the segment can maintain stronger growth and provide a meaningful counterweight to semiconductor concentration.
- Post-earnings price follow-through: whether the rebound from the September 3 low develops into durable support or the guidance concern drives further relative weakness.
The cleanest operating test is the Q4 AI forecast. Meanwhile, the next market test is whether AVGO can hold the afternoon recovery after a high-volume, benchmark-lagging first session.
Final earnings verdict
Broadcom’s fiscal Q3 operating result was stronger than the September 3 closing decline alone suggests. The company exceeded consensus revenue and adjusted EPS expectations, beat its own AI forecast, generated $13.665 billion of free cash flow, and projected another sharp increase in AI semiconductor revenue.
At the same time, the $34.8 billion total-revenue outlook landed slightly below the selected consensus. The first full-session verdict was therefore negative: AVGO fell 2.7% on nearly three times normal volume while both its sector benchmark and the Nasdaq advanced. The recovery from a 6.8% morning decline softened—but did not reverse—that judgment.
The August thesis has moved from forecast to partial confirmation. Broadcom proved it could exceed the $16 billion Q3 AI target; it has not yet proved that this growth can remain diversified and consistently exceed an exceptionally high market bar. For long-term investors, the operating evidence improved. For the first post-earnings session, the market’s answer was that a strong quarter was not strong enough.
Primary Sources
- Broadcom fiscal Q3 FY2026 financial results
- Broadcom fiscal Q2 FY2026 financial results and prior guidance
- Broadcom fiscal Q2 FY2026 Form 10-Q
- Nasdaq AVGO historical market data
- Nasdaq Composite historical market data
- iShares Semiconductor ETF
FAQ
Did Broadcom beat Q3 FY2026 earnings expectations?
Yes. Broadcom reported $29.591 billion in revenue and $3.32 in adjusted diluted EPS. Those results were approximately 0.5% and 2.8% above the selected Wall Street consensus, respectively.
How much AI semiconductor revenue did Broadcom report?
Broadcom reported $16.7 billion of fiscal Q3 AI semiconductor revenue, up 221% year over year and 54% sequentially. The result also exceeded management’s prior $16.0 billion forecast.
What is Broadcom’s Q4 FY2026 guidance?
Broadcom expects approximately $34.8 billion in total revenue, $21.7 billion in AI semiconductor revenue, and non-GAAP operating income near 66% of revenue.
Why did AVGO stock fall after Broadcom earnings?
The most likely reason was the expectations gap. Broadcom’s revenue and adjusted EPS beats were modest, while its $34.8 billion Q4 revenue outlook was about 0.7% below the selected consensus. AVGO closed the first full session down 2.7% even though its sector benchmark and the Nasdaq rose.
What did the August 1 Broadcom report get right?
It identified conversion of Broadcom’s $16.0 billion Q3 AI forecast as the immediate test. Broadcom reported $16.7 billion, confirming that part of the thesis. Its warnings about concentration, disclosure limits, and margin mix remain unresolved.
What was AVGO’s full-day earnings reaction?
AVGO opened at $351.61, touched $342.33, and recovered to close at $357.16 on September 3. The close was 2.7% below the $367.24 pre-earnings close, and volume was about three times the prior 20-session average.