
Oracle Corporation ORCL Q1 FY2027 Earnings: $19.35B Decoded
Key Takeaway
Oracle beat revenue and adjusted earnings expectations as cloud infrastructure growth accelerated. However, the quality of that growth needs a closer reading. Customer advances boosted operating cash flow, capital spending still exceeded it, and next quarter’s earnings comparison contains a one-time gain. The useful question is whether faster capacity delivery can produce stronger cash generation without another financing surge.
Introduction and completed market reaction
Oracle reported its August-quarter results after the September 10, 2026 close. Our Oracle stock report provides the broader business context. On September 11, ORCL opened at $164.43 but finished the regular session at $150.28. That was a 1.74% decline from the $152.94 pre-earnings close, despite the positive opening reaction.
This review uses September 11 at 8 p.m. Eastern Daylight Time as its market cutoff. The latest verified extended-hours quote was $147.81 at 7:59 p.m., another 1.64% below the regular close. That quote is an after-hours observation, not an official 8 p.m. closing print.
The session ranged from $149.84 to approximately $166.00, with reported volume of 78.03 million shares—about 3.43 times the preceding 20-session average. Meanwhile, the Nasdaq-100 ETF benchmark gained 0.87%, making Oracle’s reversal more company-specific than a broad technology selloff. Price action establishes the reversal; it does not prove which individual earnings detail caused it.
Educational disclaimer
This article is educational, informational research—not financial advice.
We strive to keep data accurate, but unavoidable errors or omissions may occur. Verify important information with primary sources.
The earnings findings that matter
- The beat was real: revenue exceeded consensus by approximately $215 million, while adjusted EPS beat by $0.18.
- Infrastructure drove the acceleration: OCI revenue grew 121% year over year, compared with 10% for cloud applications.
- Cash arrived ahead of service delivery: $11.363 billion of operating cash flow came from customer advances with a significant financing component.
- The funding gap remained: quarterly free cash flow was negative $5.396 billion despite those advances.
- The annual outlook changed modestly: revenue wording moved from $90 billion to at least $90 billion; adjusted EPS rose from $8.05 to $8.10.
- Next quarter needs a clean comparison: management’s underlying EPS growth excludes last year’s Ampere investment gain.
These findings describe different parts of the same earnings report. Faster infrastructure delivery explains the revenue acceleration, while payment timing affects cash conversion. Consequently, the next test must measure delivery, profitability and funding together.
What investors expected before earnings
Wall Street consensus called for approximately $19.13 billion in revenue and $1.74 in adjusted EPS. Oracle’s own June guidance implied 27%–29% revenue growth and adjusted EPS of $1.72–$1.76 in US dollars. Therefore, the independent expectation and management’s outlook set similar headline hurdles.
Cloud expectations were more nuanced. Oracle had guided total cloud growth of 58%–64% in US dollars, and the actual 62% landed inside that range. A strong growth number can meet an already ambitious target without constituting a separate guidance beat.
The comparisons below use one historical consensus series. GAAP EPS does not share the adjusted consensus baseline, so this review does not subtract one from the other. Historical surprise figures also need scrutiny when unusual investment gains enter reported adjusted earnings.
Reported versus expected scoreboard
Revenue figures use Oracle’s detailed statements rather than the rounded headline. Surprise percentages are AIStocksHub calculations against the stated consensus. Company guidance remains a separate comparison.
| Metric | Reported | Expected | Surprise | Year-over-year |
|---|---|---|---|---|
| Total revenue | $19.345B | $19.13B consensus | +$0.215B / +1.12% | +29.6% |
| Adjusted diluted EPS | $1.92 | $1.74 consensus | +$0.18 / +10.34% | +30% |
| GAAP diluted EPS | $1.56 | Comparable consensus unavailable | Not calculated | +55% |
| Total cloud revenue growth, USD | 62% | 58%–64% company guidance | Inside range | Prior-year growth: 28% |
The EPS beat was proportionally larger than the revenue beat. However, that does not mean every operating margin expanded at the same pace. The accounting reconciliation below explains why headline profit growth requires a second look.
Results across the last three quarters
The table places this quarter beside the preceding three completed fiscal quarters. Dollar figures are billions except per-share data; cash flows cover each individual quarter. Historical consensus figures represent expectations for their respective releases.
| Metric | Q2 FY2026, Nov. 2025 | Q3 FY2026, Feb. 2026 | Q4 FY2026, May 2026 | Q1 FY2027, Aug. 2026 |
|---|---|---|---|---|
| Revenue | $16.058 | $17.190 | $19.184 | $19.345 |
| Revenue consensus | $16.19 | $16.91 | $19.10 | $19.13 |
| GAAP EPS | $2.10 | $1.27 | $1.45 | $1.56 |
| Adjusted EPS | $2.26* | $1.79 | $2.11* | $1.92 |
| Adjusted EPS consensus | $1.64 | $1.71 | $1.96 | $1.74 |
| Cloud infrastructure revenue | $4.079 | $4.888 | $5.787 | $7.388 |
| Infrastructure growth, YoY | 68% | 84% | 93% | 121% |
| Total cloud revenue | $7.977 | $8.914 | $9.913 | $11.607 |
| Operating cash flow | $2.066 | $7.151 | $14.620 | $23.103 |
| Capital expenditures | $12.033 | $18.635 | $16.493 | $28.499 |
| Free cash flow | -$9.967 | -$11.484 | -$1.873 | -$5.396 |
*Q2 included an Ampere investment gain; Q4 also included a one-time investment gain. Oracle identifies Ampere and Bloom Energy transactions in its full-year comparison. Consequently, those adjusted EPS figures are not clean recurring-profit comparisons. The consensus rows alone cannot establish the operating surprise after removing those gains.
Revenue increased 0.84% sequentially, while OCI increased 27.67%. By contrast, software revenue fell from $6.824 billion in Q4 to $5.550 billion in Q1. Seasonal license sales and the changing cloud mix make the year-over-year comparison essential.
Revenue segments and AI performance
Oracle’s cloud infrastructure expansion accounts for most of the incremental revenue. However, infrastructure and applications still have different growth profiles. The detailed offering breakdown also prevents total cloud revenue from masquerading as a separately reported AI segment.
| Revenue offering | Q1 FY2027 | Q1 FY2026 | Reported USD growth |
|---|---|---|---|
| Cloud infrastructure, IaaS | $7.388B | $3.347B | 121% |
| Cloud applications, SaaS | $4.219B | $3.839B | 10% |
| Total cloud | $11.607B | $7.186B | 62% |
| Software | $5.550B | $5.721B | -3% |
| Hardware | $0.774B | $0.670B | 15% |
| Services | $1.414B | $1.349B | 5% |
IaaS and SaaS are components of total cloud, so the table must not be summed straight down. Cloud supplied approximately 60% of total revenue. In addition, OCI represented roughly 38% of company revenue, compared with about 22% a year earlier.
Software’s decline matters because the faster-growing business must replace a mature revenue source while funding physical infrastructure. Oracle attributes that decline to migration toward cloud. Still, this release does not quantify how much lost software revenue directly converted into cloud revenue.
Where revenue growth came from
The Americas contributed $13.711 billion of revenue, versus $9.662 billion a year earlier. Europe, the Middle East and Africa contributed $3.726 billion, while Asia Pacific supplied $1.908 billion. Consequently, the Americas generated approximately 92% of Oracle’s company-wide revenue increase.
This concentration helps locate the growth, but geography does not identify individual customers or their credit quality. Meanwhile, software license revenue fell 15% to $655 million and support fell 1% to $4.895 billion. Next quarter should show whether cloud expansion continues to offset both mature streams.
Margins, cash flow, and capital spending
GAAP profitability improved sharply, but the adjusted margin changed much less. Meanwhile, capital expenditure rose faster than operating cash flow in absolute dollars. All cash-flow figures below cover the quarter, not a trailing year.
| Metric | Q1 FY2027 | Q1 FY2026 | Reading |
|---|---|---|---|
| GAAP operating income | $6.728B | $4.277B | +57% |
| GAAP operating margin | 34.78% | 28.65% | About +612 basis points |
| Adjusted operating income | $8.151B | $6.236B | +31% |
| Adjusted operating margin | 42.13% | 41.78% | About +35 basis points |
| Operating cash flow | $23.103B | $8.140B | Includes customer advances |
| Capital expenditures | $28.499B | $8.502B | Gross cash-flow-statement measure |
| Free cash flow | -$5.396B | -$0.362B | Operating cash flow less capex |
| Depreciation | $3.156B | $1.351B | Higher asset-cost burden |
| Interest expense | $1.428B | $0.923B | Higher financing burden |
Margin percentages are AIStocksHub calculations from the reported dollar amounts. Oracle’s headline rounds both adjusted margins to 42%. Therefore, the result supports modest adjusted operating leverage, rather than the dramatic expansion suggested by GAAP alone.
Earnings announcement decoded
More infrastructure reached customers
Oracle reported 850 megawatts of additional data-center capacity and more than 300,000 GPUs delivered since Q4 ended. Those disclosures strengthen the delivery argument behind OCI growth. However, equipment and power capacity do not disclose standalone project profitability; next quarter must connect delivery to revenue and cash conversion.
Backlog increased, but bookings are not sales
Remaining performance obligations reached $664 billion, versus $638 billion at May-end. That represents approximately 4.1% sequential growth, alongside more than $30 billion of new AI cloud contracts. Yet RPO covers future obligations across periods; it is neither current-quarter revenue nor cash already collected.
New contracts change who supplies the capital
Management describes prepayment and customer-supplied hardware structures for new business. These arrangements can reduce Oracle’s upfront funding requirement. Still, they do not eliminate delivery obligations, customer risk or spending on previously signed contracts; watch the actual financing reconciliation.
Product announcements need financial proof
The release introduces an AI data platform and agent-based healthcare software. These announcements describe intended capabilities rather than separately measured quarterly profit contributions. Consequently, adoption, recognized revenue and implementation results matter more than broad claims about future benefits.
Why cash flow needs two separate calculations
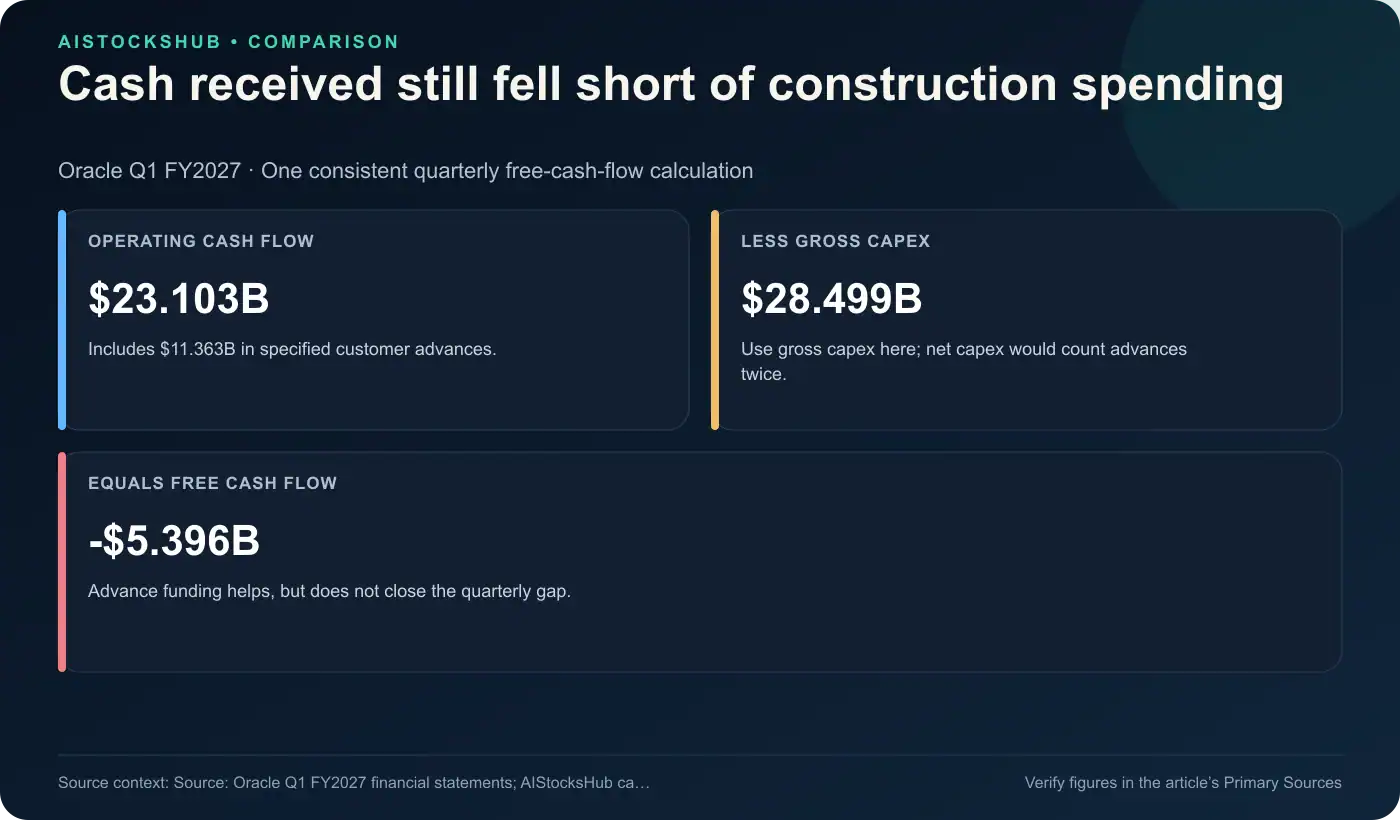
Oracle’s operating cash flow includes $11.363 billion of customer prepayments with a significant financing component. Those advances help fund construction before Oracle earns the associated service revenue. They are genuine cash receipts, but their timing limits what the headline says about repeatable cash generation.
First, the reported free-cash-flow calculation is straightforward: $23.103 billion of operating cash flow minus $28.499 billion of capex. That equals negative $5.396 billion. The calculation already includes the benefit of customer advances once.
Second, Oracle’s net cash outlay for capex is $17.966 billion. Its reconciliation starts with $28.499 billion, adds $0.830 billion of related financing repayments, and subtracts $11.363 billion of advances. This measures funding needs differently from gross capex.
Subtracting net capex from unadjusted operating cash flow would imply positive $5.137 billion. However, that combination counts the same customer advances twice and is not Oracle’s reported free cash flow. Removing only those specified advances from operating cash flow gives $11.740 billion—a diagnostic calculation, not a new recurring-cash-flow measure.
What the profit reconciliation reveals
Oracle excluded $1.127 billion of stock compensation, $202 million of acquired-intangible amortization, and $94 million of restructuring expenses. Together, those adjustments bridge GAAP operating income of $6.728 billion to adjusted income of $8.151 billion. Stock compensation remained almost unchanged from the prior year.
Amortization and restructuring costs fell substantially, while sales and marketing expense declined 12% and research spending declined 4%. Consequently, lower costs outside direct service delivery supported operating margins. This does not establish that infrastructure unit economics improved by the same amount.
Cloud-and-software operating expenses rose 77%, versus approximately 33% growth in their combined revenue. That comparison indicates pressure on the combined cost base, but it is not an OCI-only margin. Oracle did not provide a standalone OCI profit calculation in the release.
Oracle also discloses a $958 million tax charge in the prior-year quarter related to US tax legislation. Its adjusted comparison excludes that charge, another reason to keep GAAP and adjusted growth separate. Stock compensation and intangible amortization remain recurring costs despite their exclusion from adjusted earnings.
Tax treatment also matters. The GAAP effective rate rose from 14.6% to 15.1%, while the adjusted rate fell from 20.5% to 16.9%. Therefore, readers should examine pretax performance alongside adjusted EPS rather than attributing the whole earnings gain to operations.
What financing and dilution changed
Oracle completed its previously announced $20 billion common-stock program during the quarter. Net proceeds were $19.909 billion after issuance costs. That financing strengthens liquidity, but completing this program does not promise that Oracle will never issue equity again.
Diluted weighted-average shares increased from 2.909 billion to 3.000 billion, about 3.1% year over year. Meanwhile, preferred dividends reduced earnings available to common shareholders by $81 million. These details help explain why common-share EPS grows differently from company net income.
Cash and equivalents on the balance sheet reached $36.369 billion, plus $0.708 billion of marketable securities. Current and non-current borrowings totaled approximately $125.337 billion. However, those borrowings exclude the separately reported lease obligations and should not be described as every financial commitment.
The cash-flow statement ends with $38.934 billion including restricted cash. Its difference from balance-sheet cash is $2.565 billion, so the two totals should not be used interchangeably. In addition, the quarterly dividend of $0.50 has an October 9 record date and October 23 payment date.
Updated guidance
The annual revenue message is a change in wording as much as magnitude. June’s release already projected $90 billion; the new release says at least $90 billion. Therefore, it would overstate the change to present the entire $90 billion as a newly raised target.
| Guidance item | New outlook | Comparison and meaning |
|---|---|---|
| Q2 FY2027 revenue growth | 30%–34%, USD and constant currency | Approximately $20.875B–$21.518B using prior-year revenue |
| Q2 total cloud growth | 65%–71% USD; 64%–70% constant currency | Requires further acceleration from Q1 |
| Q2 adjusted EPS | $1.85–$1.93 USD | Management says +21%–25%, excluding prior-year Ampere gain |
| FY2027 revenue | At least $90B | Previously $90B |
| FY2027 adjusted EPS | $8.10 | Previously $8.05; +$0.05 |
The Q2 revenue dollars are AIStocksHub calculations, not a separately issued dollar range. Guidance describes management’s expectations rather than achieved results. The table avoids mixing differently timed consensus estimates into the outlook comparison.
The earnings call also maintained gross annual capex of $90 billion–$95 billion and net cash capex of no more than $70 billion. Management described spending as uneven across the year. Consequently, multiplying this quarter’s capex by four would misrepresent the stated outlook.
The one-time gain inside next quarter’s EPS comparison
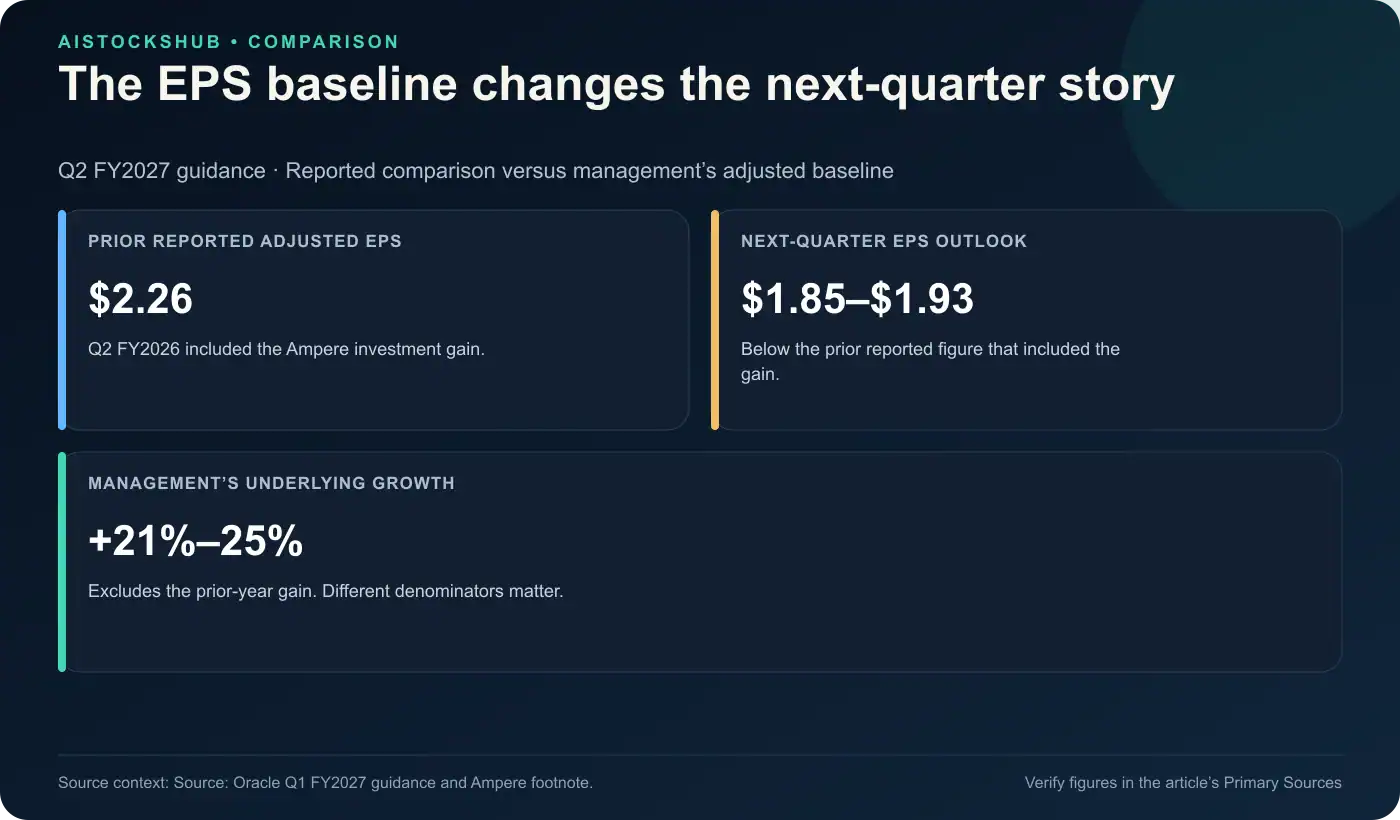
Q2 FY2026 adjusted EPS was $2.26, including the Ampere investment gain. Against that reported number, the new $1.85–$1.93 range implies a decline of roughly 18%–15%. Oracle states an 18%–14% decline; calculations from the rounded EPS endpoints differ slightly.
However, management also describes growth of 21%–25% after excluding that prior-year gain. Both descriptions can be true because the denominators differ. Neither should appear without its comparison basis.
This is why the historical table retains the reported figure and flags the unusual item. Readers should compare underlying earnings with an underlying baseline, then separately assess GAAP earnings and cash flow. Next quarter’s headline EPS direction alone will not settle whether operations improved.
Market expectations
A publicly aggregated September 2026 ratings snapshot contains 44 recommendations. The categories below combine Strong Buy with Buy, and Strong Sell with Sell. The source does not provide an exact historical 8 p.m. timestamp for this monthly ratings breakdown.
| Analyst rating | Count |
|---|---|
| Buy, including Strong Buy | 36 |
| Hold | 7 |
| Sell, including Strong Sell | 1 |
| Total recommendations | 44 |
Price targets describe a separate 43-analyst cohort from the same provider, rather than all 44 recommendations. The current close provides a consistent reference for the target range. These September 11 figures are not an independently archived reconstruction of targets at precisely 8 p.m.
| Price reference | USD per share |
|---|---|
| Current regular-session close, September 11 | $150.28 |
| Lowest 12-month target | $110.00 |
| Consensus/average 12-month target | $239.10 |
| Highest 12-month target | $400.00 |
The average stands approximately 59.1% above the regular close. However, the low target sits below it and the range is exceptionally wide. These changing third-party estimates are neither Oracle’s earnings guidance nor promised investment returns.
What improved versus what disappointed
Infrastructure revenue accelerated, total revenue exceeded expectations, and operating profit increased. Oracle also converted customer commitments into meaningful advance funding. Together, those results support stronger execution than a backlog headline alone would demonstrate.
However, gross capital spending reached a new high within the four-quarter comparison. Free cash flow deteriorated from Q4, and adjusted operating-margin expansion remained modest. The software decline also shows that the transition does not lift every revenue stream equally.
The completed stock reversal reflects a gap between strong headline growth and the market’s broader expectations. Funding needs and profit quality provide plausible explanations, but the tape cannot isolate their individual effects. Therefore, the earnings verdict should rest on the statements rather than an invented account of investor motives.
What to watch next quarter
The next release should show whether execution remains on track and whether funding quality improves. Each checkpoint below connects directly to a disclosed result or management target. Missing details should remain open questions rather than assumed successes.
| Checkpoint | Current evidence | Next-quarter test |
|---|---|---|
| Revenue delivery | $19.345B this quarter | Achieve 30%–34% Q2 growth |
| Cloud acceleration | 62% total cloud growth | Reach 65%–71% USD guidance |
| Capacity conversion | 850MW delivered | Connect new capacity to recognized sales |
| Cash-flow quality | $11.363B specified advances | Separate repeat cash generation from new advance payments |
| Capital discipline | $28.499B quarterly gross capex | Reconcile spending with annual gross/net guidance |
| Profitability | About 42.13% adjusted operating margin | Sustain margins as infrastructure mix rises |
| EPS comparability | Q2 outlook excludes prior Ampere gain | Reconcile reported and underlying growth explicitly |
| Financing | $20B equity program completed | Explain any new funding and per-share effects |
Final earnings verdict
Oracle delivered a stronger revenue and adjusted-EPS result than consensus expected. More infrastructure reached customers, and cloud growth accelerated. The quarter therefore provides evidence of delivery, not simply another large backlog announcement.
However, the funding and accounting details prevent a simple victory lap. Customer advances materially supported cash flow, gross capex still exceeded it, and adjusted margins improved only modestly. The next earnings report must show how revenue growth translates into cash after funding and per-share costs.
Primary Sources
- Oracle Q1 FY2027 earnings release and financial statements
- Oracle Q4 and FY2026 results, including prior guidance
- Oracle Q3 FY2026 financial results
- Oracle Q2 FY2026 financial results
FAQ
Did Oracle beat Q1 FY2027 earnings expectations?
Yes. Revenue of $19.345 billion exceeded approximately $19.13 billion expected, while adjusted EPS of $1.92 exceeded $1.74. GAAP EPS was $1.56 and requires a separate comparison basis.
Why was Oracle’s free cash flow negative despite record operating cash flow?
Quarterly capex of $28.499 billion exceeded operating cash flow of $23.103 billion. The resulting free-cash-flow deficit was $5.396 billion. Operating cash flow already included the specified customer advances.
Does the $664 billion backlog represent revenue Oracle has already earned?
No. Remaining performance obligations represent contracted future obligations. Recognition depends on delivery and contractual timing; the balance is not current revenue or cash already received.
Why can next quarter’s EPS grow on one basis and decline on another?
Last year’s comparison quarter included an Ampere investment gain. Oracle’s underlying growth guidance excludes that gain, while comparison with reported adjusted EPS includes it. The different baselines produce different growth rates.
What was Oracle’s share price at the September 11 cutoff?
ORCL closed the regular session at $150.28. The latest verified quote before the 8 p.m. EDT cutoff was $147.81 at 7:59 p.m. after hours. It was not an official 8 p.m. regular-session close.
Are analysts’ price targets part of Oracle’s earnings guidance?
No. The $239.10 average target belongs to a third-party 43-analyst snapshot. Oracle guides business results; analysts independently estimate share values and revise them over time.