SMCI Unusual Options Trades — Breaking Down Institutional Activity
There were several large options trades in Super Micro Computer (SMCI) that stood out due to their size and structure.
These were not isolated trades or simple call buying. The activity involved large, structured positions across multiple strikes, suggesting institutional participation.
In this article, we break down:
- What qualifies as unusual options activity
- The specific SMCI trades that occurred
- What these trades likely indicate
What Is Unusual Options Activity?
Unusual options activity refers to trades that stand out compared to normal market behavior. These typically include:
- Contract volumes significantly higher than existing open interest
- Large premium values, often exceeding tens of thousands of dollars
- Multi-leg trades, such as spreads, rather than single-option positions
However, large trades alone do not define direction.
To properly interpret unusual options activity, it is necessary to evaluate:
- Whether trades were executed near the bid or ask
- How multiple legs are structured together
- The size and consistency of the trades
This is especially important when analyzing institutional activity, where trades are often structured to manage risk and cost rather than simply express a directional view.
The SMCI Trades — What Actually Happened
Among the options activity in SMCI, several large trades stood out due to their size and structure.
These were not isolated transactions. The activity involved multi-leg positions across multiple strikes, forming a consistent pattern of structured institutional positioning.
Key Trades
| Strike Price | Volume | Open Interest | Trade Price | Total Trade Value |
|---|---|---|---|---|
| 35.5 Call | ~17,300 | Significantly lower than volume | ~1.16 | ~$2.0M |
| 37 Call | ~17,300 | Significantly lower than volume | ~0.66 | ~$1.1M |
| 36.5 Call | ~20,800 | Significantly lower than volume | ~0.80–0.85 | ~$1.6M+ |
| 38.5 Call | ~20,800 | Significantly lower than volume | ~0.36 | ~$750K |
These trades stand out for two reasons:
- Volume exceeded open interest in each case, indicating new positions being opened rather than existing positions being closed
- The trades appear in paired strikes, pointing to multi-leg spread structures rather than simple single-leg directional bets
Before breaking down what these trades likely mean, it is important to briefly understand what SMCI does as a business and why the company has remained one of the market’s more volatile AI-related stocks.
What Does SMCI Do?
Super Micro Computer (SMCI) designs and manufactures high-performance servers and data center infrastructure used in artificial intelligence, cloud computing, and enterprise workloads.
The company became one of the major beneficiaries of the AI infrastructure boom due to strong demand for GPU-optimized servers used alongside NVIDIA AI systems.
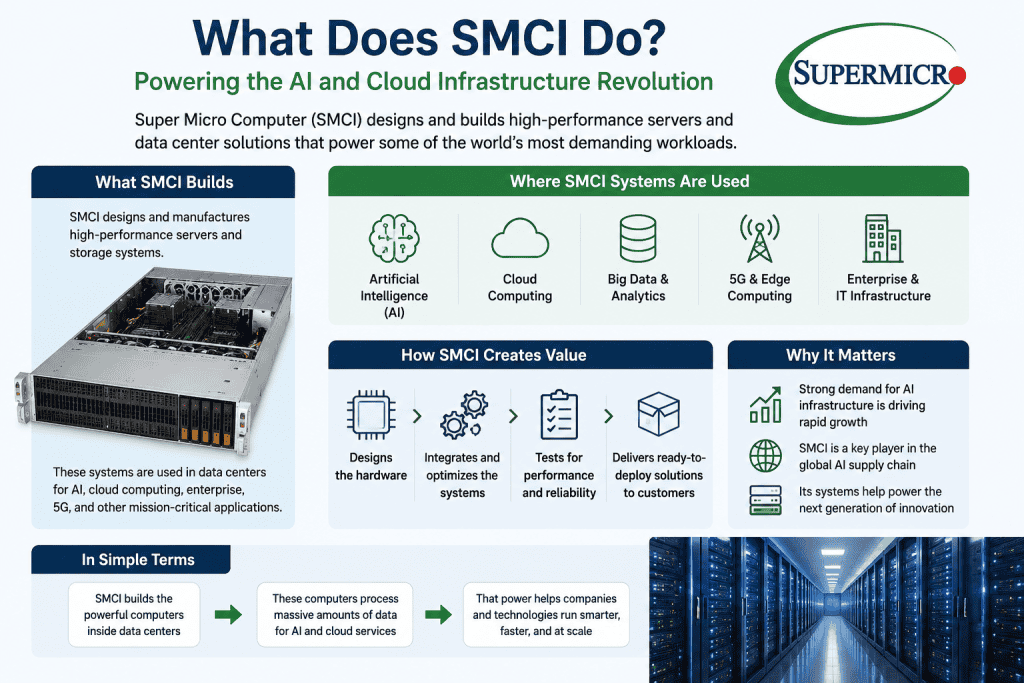
As AI-related spending accelerated, SMCI experienced rapid revenue growth and became one of the market’s most actively traded AI infrastructure stocks.
Recent Accounting and Litigation Concerns
Despite strong business growth, SMCI has also faced significant controversy over the past two years.
The company dealt with:
- Delayed financial filings
- Auditor resignation concerns
- Nasdaq delisting risk
- SEC and DOJ scrutiny tied to accounting and governance issues
SMCI later filed its delayed financial reports and regained Nasdaq compliance, avoiding delisting concerns.
The company has also remained under investor scrutiny following investigations and litigation tied to accounting controls and governance practices.
Despite these issues, institutional interest in the stock has remained elevated because of continued AI infrastructure demand and SMCI’s position within the broader AI supply chain.
SMCI Financial Performance — Last 3 Years
Over the last three years, Super Micro Computer (SMCI) has transformed from a relatively small server manufacturer into one of the fastest-growing companies tied to the artificial intelligence infrastructure boom.
The company experienced explosive growth as demand surged for AI-optimized servers used in data centers and cloud computing environments. Much of this growth was driven by strong demand for systems built around NVIDIA GPUs and large-scale AI deployments.
| Fiscal Year | Revenue | Net Income | EPS |
|---|---|---|---|
| 2023 | ~$7.1B | ~$640M | ~$1.14 |
| 2024 | ~$15.0B | ~$1.15B | ~$1.92 |
| 2025 | ~$22.0B | ~$1.05B | ~$1.68 |
Revenue Growth
The most significant trend has been revenue growth.
- Revenue grew from roughly $7.1 billion in 2023 to nearly $15 billion in 2024, more than doubling in a single year.
- Revenue then increased again to approximately $22 billion in 2025.
This level of growth is unusual even among high-growth technology companies and reflects the massive increase in AI infrastructure spending across the industry. While revenue expanded rapidly, profitability became more volatile.
- Net income increased sharply in 2024 alongside AI demand growth
- EPS nearly doubled between 2023 and 2024
- However, earnings moderated in 2025 despite continued revenue growth
This reflects several pressures:
- Margin compression
- Higher operating costs
- Rapid expansion spending
- Supply chain and inventory challenges
The company also faced accounting and governance concerns during this period, which contributed to elevated stock volatility.
Dissecting the Trade Structure: How These SMCI Options May Work Together
The large SMCI trades were not simple one-off call purchases. Several of the trades were executed in matching sizes across different strikes, which suggests that they were part of multi-leg strategies.
In options trading, a multi-leg order means two or more options are executed together as part of one combined position. This matters because a single option trade may look bullish or bearish on its own, but the full strategy can tell a different story.
For SMCI, the large trades were concentrated across the 35.5, 36.5, 37, and 38.5 call strikes, all with the same short-dated expiration. This creates a structured range of exposure rather than a simple bet that the stock will move higher without limits.
How Bid, Ask, and Midpoint Help Interpret the Trade
Options flow data does not always clearly state whether the trader was buying or selling. However, the trade price relative to the bid and ask provides an important clue.
If an option trades closer to the ask, it usually suggests the buyer was more aggressive. This often indicates buying pressure. If an option trades closer to the bid, it usually suggests the seller was more aggressive. This often indicates selling pressure. If a trade occurs near the midpoint, the direction is less certain.
In the SMCI trades, several large prints occurred near the midpoint, so the data is not as clean as a simple “bought at ask” or “sold at bid” signal. However, when the trades are grouped by size, strike, and execution pattern, the activity points to structured spread positioning rather than outright call buying.
The 35.5 / 37 Call Spread
One of the largest paired structures involved the 35.5 call and the 37 call, both traded in roughly 17,300-contract size.
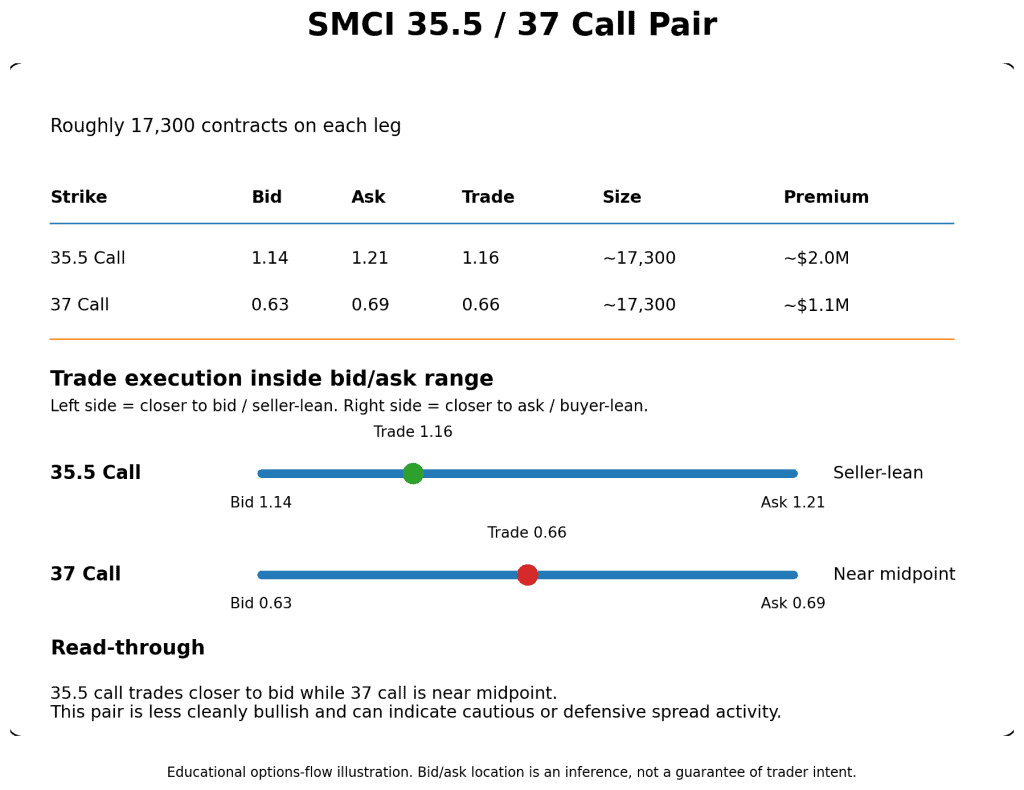
Because both legs appeared in the same size, this likely represents a vertical spread.
If the 35.5 call was bought and the 37 call was sold, the trade would be a bull call debit spread. That structure benefits if SMCI rises above the lower strike and moves toward or above 37.
If the 35.5 call was sold and the 37 call was bought, the trade would be a call credit spread. That structure benefits if SMCI stays below the lower strike or does not move too far above it.
The execution price is important here. The 35.5 call traded at 1.16, while the bid/ask was approximately 1.14 / 1.21. That is closer to the bid than the ask, which leans more toward selling pressure. The 37 call traded around 0.66, near the midpoint of its bid/ask range.
That makes this spread less clearly bullish than a simple call purchase. It may represent a cautious or defensive structure, or it may be part of a larger position where the trader is managing risk around the 35.5 to 37 range.
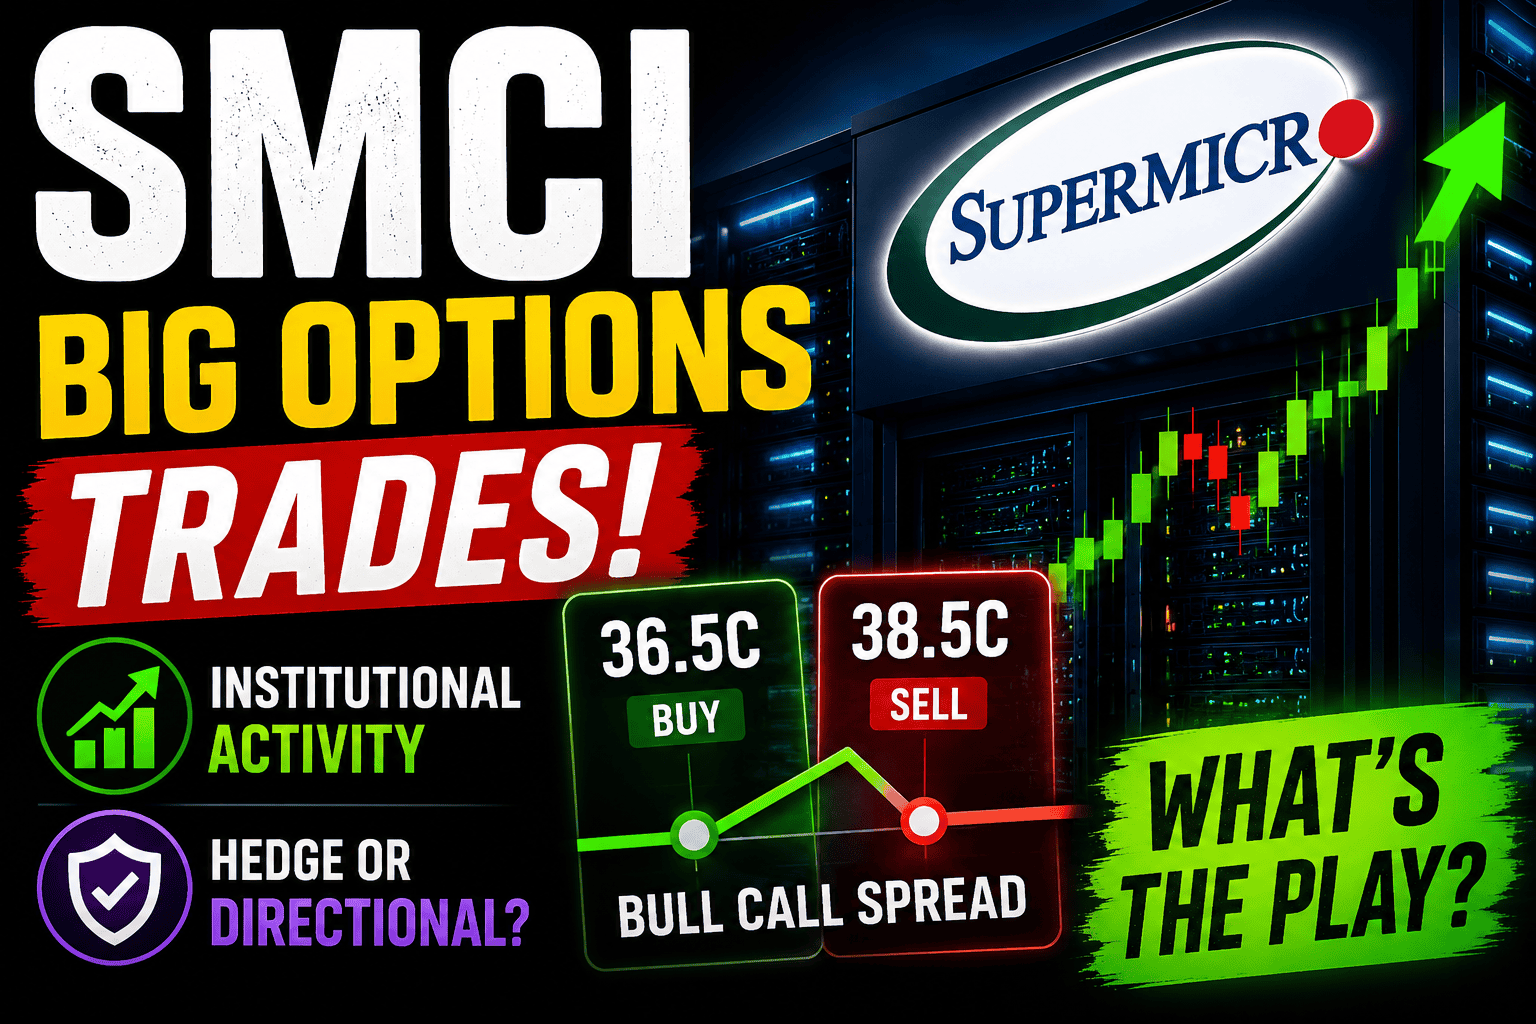
The 36.5 / 38.5 Call Spread
Another major structure involved the 36.5 call and the 38.5 call, with more than 20,000 contracts traded in matching size.
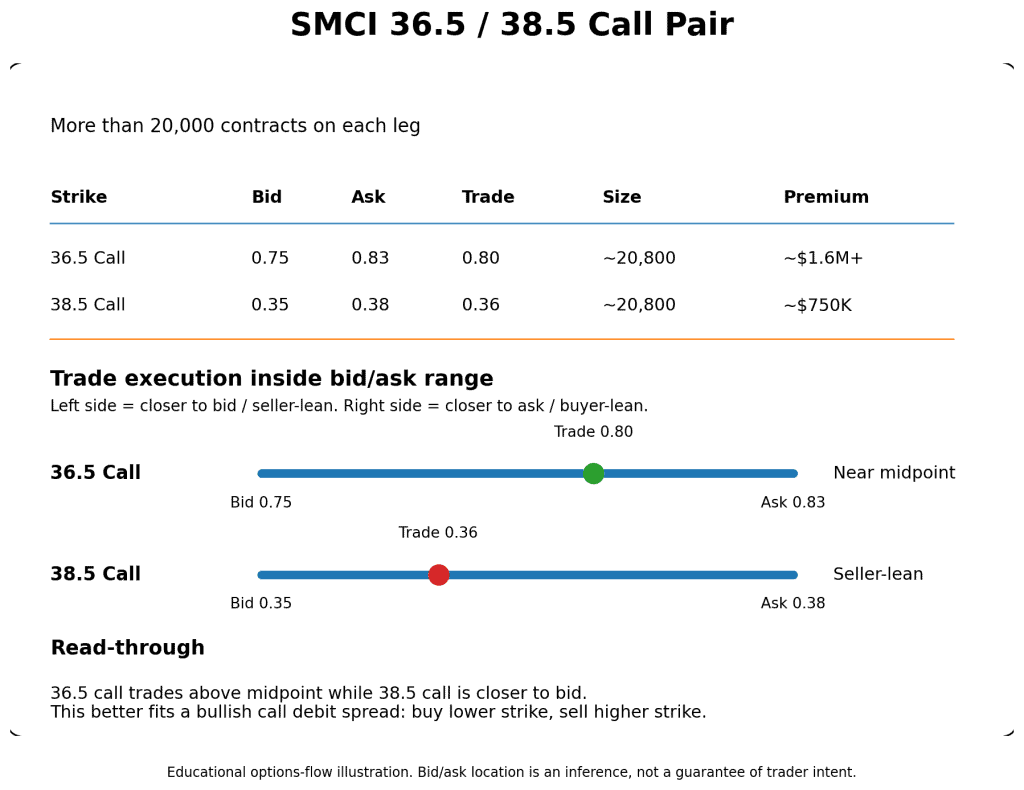
This pairing looks more constructive.
The 36.5 call traded around 0.80, while the bid/ask was approximately 0.75 / 0.83. That is above the midpoint and closer to the ask, suggesting stronger buying interest in the lower strike call.
The 38.5 call traded around 0.36, while the bid/ask was approximately 0.35 / 0.38. That is closer to the bid, suggesting selling pressure in the higher strike call.
Taken together, this points to a likely bull call debit spread:
Buy the 36.5 call and sell the 38.5 call.
This structure benefits if SMCI continues higher, especially if the stock moves above the breakeven area and toward the 38.5 strike.
What the Combined Structure Suggests
When all the large trades are viewed together, the structure does not look like simple bullish call buying. It looks more like institutional positioning across a defined price zone.
The trades appear to create exposure across the following range:
- Lower zone: 35.5
- Middle zone: 36.5 to 37
- Upper zone: 38.5
This suggests the main area of interest is between roughly 36 and 38.5.
The trader does not appear to be paying for unlimited upside. Instead, the structure uses higher strike calls to reduce cost and define the reward range. This is common when traders expect a stock to continue higher but do not necessarily expect an unlimited breakout.
How These Trades May Scale Out
One possible interpretation is that the trades were built in stages.
The trader may have first established exposure in one spread, then added another spread at higher strikes as the stock held strength. This would create a layered position where each spread targets a different upside zone.
For example:
| Spread Zone | Possible Structure | What It Targets |
|---|---|---|
| 35.5 / 37 | Lower call spread | Move toward 37 |
| 36.5 / 38.5 | Higher call spread | Follow-through toward 38.5 |
This type of scaling can allow a trader to participate in continued upside while keeping risk defined.
Instead of placing one large bet at a single strike, the trader spreads exposure across multiple strikes. That can help manage execution, reduce premium cost, and create a more flexible payoff profile.
Why This Is Not Simple Call Buying
Simple call buying would involve purchasing calls outright and keeping unlimited upside exposure.
That is not what appears to be happening here.
The SMCI activity shows:
- Large trades across paired strikes
- Matching contract sizes
- Same expiration
- Multi-leg execution codes
- Higher strikes likely being used to offset the cost of lower strike calls
This points to structured spread activity rather than outright speculation.
The difference is important.
Outright call buying says:
The trader wants unlimited upside.
A call spread says:
The trader expects upside, but only within a defined range.
That distinction changes the interpretation of the entire options flow.
Main Interpretation
The strongest interpretation is that institutional traders were using SMCI call spreads to position for continued upside after the stock had already made a sharp move.
The trades do not suggest blind bullish speculation. They suggest a more disciplined strategy:
defined risk, reduced cost, and a target zone between roughly 37 and 38.5.
The earlier 35.5 / 37 structure appears more cautious, while the larger 36.5 / 38.5 spread provides the clearer bullish signal. Taken together, the activity suggests that traders were not simply chasing SMCI higher; they were structuring exposure around a specific upside range.
Conclusion: What the SMCI Options Activity Really Shows
The SMCI options activity points to institutional involvement, but it does not provide a guaranteed bullish or bearish signal.
The trades were structured around a defined price zone, mainly between the 35.5 and 38.5 call strikes. Some activity leaned bullish, especially the larger 36.5 / 38.5 spread, while other activity looked more cautious or defensive. That mix suggests institutions were managing exposure rather than making a simple one-directional bet.
The key lesson is that options flow can show where large money is active, but it cannot always reveal why that money is active. A trade may be directional, part of a hedge, tied to an existing stock position, or connected to a larger portfolio strategy. Without seeing the full position, copying the trade can create a completely different risk profile.
For individual traders, that means unusual options activity should be treated as a research signal, not a standalone trade trigger. Participating after a sharp move in a volatile stock like SMCI can be speculative, especially when the institutional intent is unclear.
A more disciplined approach is to define risk before entering. For example, bullish exposure can be paired with protection, such as owning shares or calls while using puts to limit downside. Defined-risk structures help ensure the maximum loss is known before the trade is placed.
Disclaimer: This article is for educational and informational purposes only. It is not financial or investment advice, and it is not a recommendation to buy or sell any security. Options trading involves significant risk and may not be suitable for all investors.