
Fabrinet Q4 FY2026 Earnings: Why FN Stock Fell 20%
Key Takeaway
Fabrinet beat revenue and adjusted-EPS expectations and issued another growth guide. Nevertheless, FN still fell 20.5% as investors weighed a demanding valuation against slight gross-margin pressure, surging investment, and weak free-cash-flow conversion.
Introduction and immediate market reaction
Fabrinet’s Q4 FY2026 report looked strong at first glance. Specifically, revenue rose 44.6% to a record $1.316 billion, while non-GAAP diluted EPS rose 54.7% to $4.10. Both figures beat the cited consensus and exceeded the high end of management’s prior guidance.
Still, the stock reversed sharply. Specifically, FN closed at $598.58 on August 17 before the after-close release, initially traded about 7.5% lower near $553.58 after hours, and closed the August 18 regular session at $476.04. That represents a 20.5% one-session decline from the pre-earnings close.
The contradiction is the central issue. In other words, demand stayed strong, but investors also found modest gross-margin pressure, much higher inventory and capital spending, and almost no full-year free cash flow. Meanwhile, a broad AI-stock selloff raised the penalty for any result that failed to clear an already high expectations bar.
Educational disclaimer
This article is educational, informational research—not financial advice.
We strive to keep data accurate, but unavoidable errors or omissions may occur. Verify important information with primary sources.
What investors expected before earnings
A widely reported Wall Street consensus called for Q4 revenue of $1.28 billion and non-GAAP EPS of $3.81. Fabrinet’s own May outlook called for $1.25 billion-$1.29 billion in revenue and non-GAAP EPS of $3.72-$3.87. Therefore, investors were not merely waiting for year-over-year growth; they were looking for another clear beat.
Additionally, the setup included a demanding valuation. Notably, at the $598.58 pre-release close, FN traded at about 42.5 times the non-GAAP EPS it would report for FY2026. That editorial calculation helps explain why strong results could still disappoint the market.
In addition, investors needed evidence that capacity expansion could support growth without eroding margins or cash flow. Data-center optics remained the primary growth narrative, but the stock price had already assigned substantial value to that narrative.
Reported versus expected scoreboard
The expected figures below use one consistent Wall Street consensus snapshot reported around the release. They represent third-party market estimates, not Fabrinet’s guidance.
| Metric | Reported | Expected | Surprise | Year-over-year |
|---|---|---|---|---|
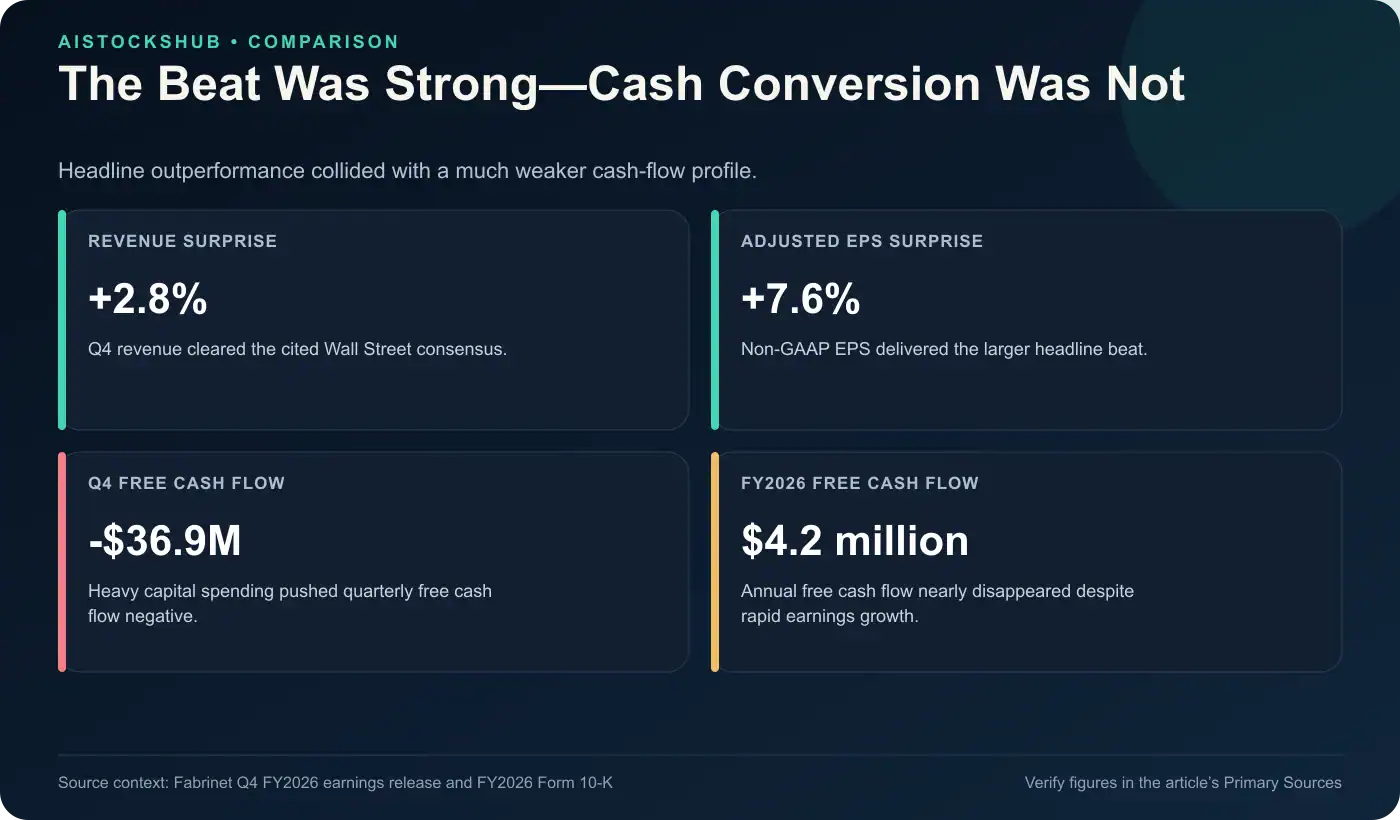
| Revenue | $1.316B | $1.28B | +$35.8M / +2.8% | +44.6% |
| Non-GAAP diluted EPS | $4.10 | $3.81 | +$0.29 / +7.6% | +54.7% |
Moreover, Fabrinet beat its own prior ranges. Revenue exceeded the $1.29 billion high end by $25.8 million, while non-GAAP EPS exceeded the $3.87 high end by $0.23. Thus, the selloff did not follow a conventional headline miss.
Revenue segments and AI performance
Fabrinet changed its end-market presentation in Q4 to better reflect the business. Specifically, the new categories are data center; communications infrastructure; and automotive, industrial, and other markets. However, the company disclosed comparable figures for the full fiscal year rather than a standalone Q4 segment table.
| Disclosed end market | FY2026 | FY2025 | Change |
|---|---|---|---|
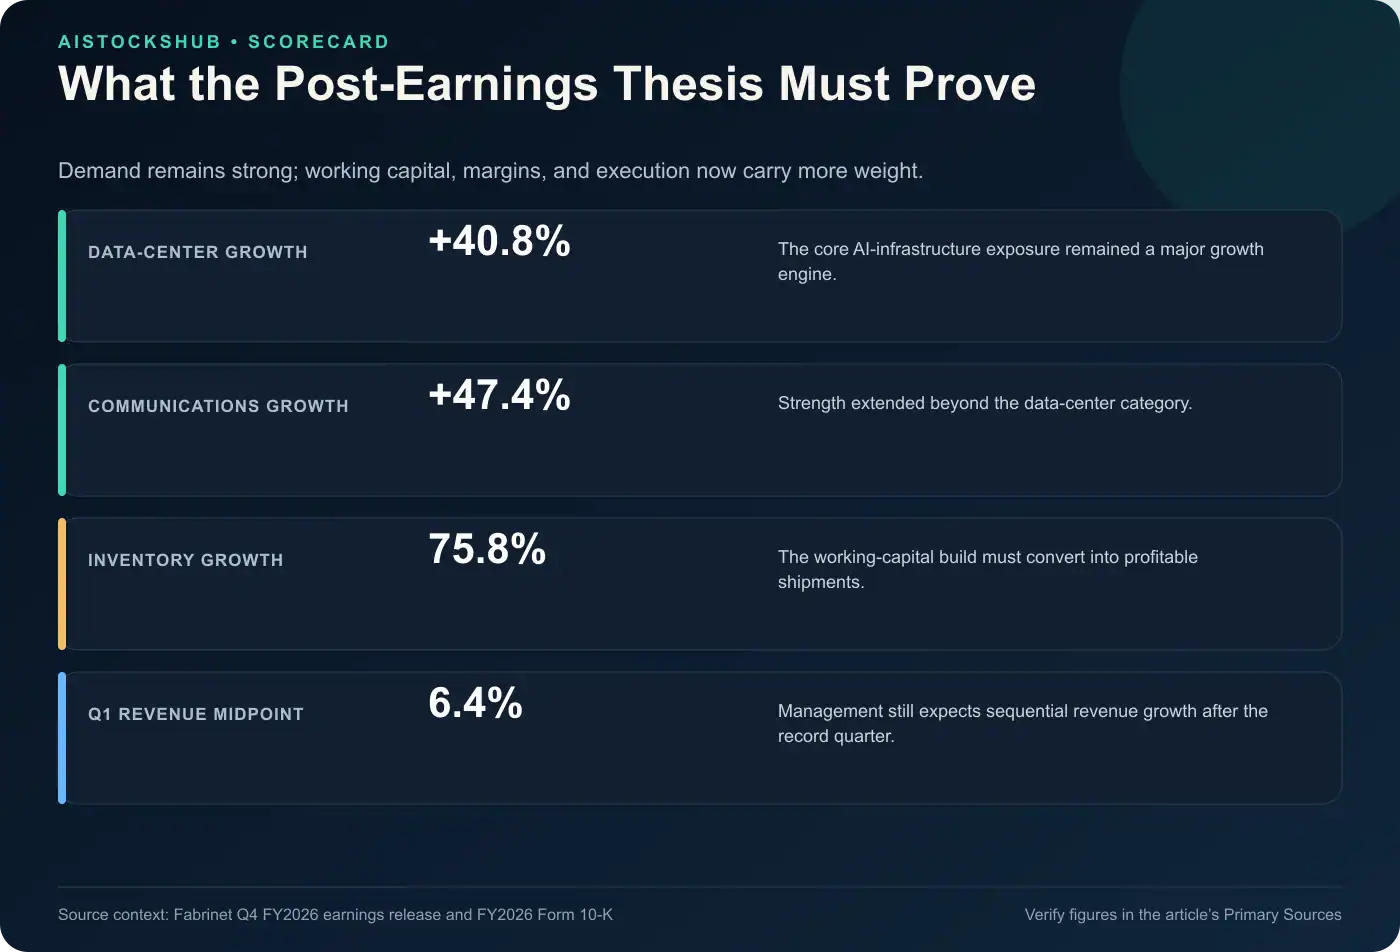
| Data center | $2.225B | $1.580B | +40.8% |
| Communications infrastructure | $1.546B | $1.049B | +47.4% |
| Automotive, industrial, and other | $869.6M | $790.0M | +10.1% |
The data-center category includes data-center interconnect, high-performance computing, and other data-center-specific applications. Consequently, that makes Fabrinet relevant to the AI infrastructure cycle. Still, the company does not disclose a standalone “AI revenue” figure, so the data-center total is the more defensible metric.
Customer exposure also connects FN to the wider market. In fact, Cisco, Nvidia, Nokia, and Amazon generated 57.4% of FY2026 revenue combined. This concentration makes Fabrinet a useful networking-demand read-through, but it also increases the impact of customer programs, sourcing decisions, and component availability.
Margins, cash flow, and capital spending
Fabrinet produced better operating leverage despite a slight decline in gross margin. By contrast, cash conversion weakened because the company invested heavily in capacity and working capital. That tension matters more than the headline growth rate alone.
| Metric | Q4 FY2026 | Q4 FY2025 | Change |
|---|---|---|---|
| GAAP gross margin | 12.0% | 12.2% | -0.2 points |
| GAAP operating margin | 10.2% | 9.8% | +0.4 points |
| Operating cash flow | $55.0M | $55.1M | Roughly flat |
| Capital expenditures | $91.9M | $50.4M | +82.2% |
| Free cash flow | -$36.9M | $4.7M | -$41.6M |
The full-year comparison is even more striking. Specifically, FY2026 operating cash flow fell 21.8% to $256.7 million, while capital expenditures more than doubled to $252.5 million. As a result, free cash flow fell to $4.2 million from $207.3 million.
Inventory rose 75.8% to $1.021 billion, versus 35.7% annual revenue growth. Although that build may support future shipments, it also increases execution risk. Investors now need evidence that the additional inventory and manufacturing capacity will convert into revenue, margins, and cash.
Updated guidance
Management’s Q1 FY2027 outlook still points to growth. At the midpoint, revenue would rise about 6.4% sequentially from Q4, while non-GAAP EPS would increase about 1.8%.
| Q1 FY2027 guidance | Low | High | Midpoint |
|---|---|---|---|
| Revenue | $1.375B | $1.425B | $1.400B |
| GAAP diluted EPS | $3.39 | $3.54 | $3.47 |
| Non-GAAP diluted EPS | $4.10 | $4.25 | $4.18 |
The gap between GAAP and non-GAAP EPS guidance is unusually important this quarter. In particular, Fabrinet’s reconciliation includes $0.40 per share related to its Pillar Two tax provision, plus $0.31 of share-based compensation. Investors should keep those exclusions visible rather than comparing only the adjusted figure.
Market expectations
The following publicly aggregated Wall Street snapshot is as of August 18, 2026, after analysts began updating their post-earnings views. Its seven-analyst cohort showed 5 Buy, 2 Hold, and 0 Sell ratings. These changing third-party estimates are neither Fabrinet-reported facts nor investment instructions.
| Analyst rating | Count |
|---|---|
| Buy | 5 |
| Hold | 2 |
| Sell | 0 |
Ratings express directional opinions. Price targets describe the same analyst cohort’s valuation range relative to FN’s current regular-session closing price.
| Price measure | Value |
|---|---|
| Current regular-session close, August 18, 2026 | $476.04 |
| Lowest 12-month target | $598.00 |
| Average 12-month target | $726.00 |
| Highest 12-month target | $850.00 |
The range remains wide even after the selloff. For example, some analysts raised targets after the quarter, while another lowered its target and kept a Hold view. Therefore, the figures show disagreement about valuation rather than a reliable path for the share price.
Management commentary
Chief Executive Officer Seamus Grady called the quarter “exceptional” and described FY2026 as a year of accelerating growth and strong momentum. He also pointed to multiple significant growth drivers and expressed optimism about FY2027. The new guidance supports that confidence because its midpoint calls for another sequential revenue record.
Furthermore, the 10-K supports the breadth of the demand story. Data-center revenue increased 40.8% for the year, while communications infrastructure grew even faster at 47.4%. In other words, Fabrinet’s growth did not depend on one disclosed end market.
However, management’s optimism does not eliminate the cash-flow question. Heavy inventory and factory investment can be rational during a major capacity ramp. Even so, the market will want those outlays to produce stronger free cash flow as shipments scale.
What improved versus what disappointed
- Improved: Revenue beat consensus by about 2.8% and exceeded the high end of company guidance.
- Improved: Non-GAAP EPS beat consensus by about 7.6%, while GAAP and non-GAAP operating margins expanded.
- Improved: The Q1 revenue midpoint implies another 6.4% sequential increase.
- Disappointed: GAAP and non-GAAP gross margins declined modestly from the prior-year quarter.
- Disappointed: Q4 free cash flow was negative $36.9 million as capital spending rose 82.2%.
- Disappointed: Full-year inventory rose 75.8%, while full-year free cash flow fell from $207.3 million to $4.2 million.
Why the stock moved
FN’s decline looks like an expectations and valuation reset, not a verdict that demand disappeared. The company beat consensus and its prior guide, then issued an outlook that still called for sequential growth. Those facts weaken any simple “bad earnings” explanation.
However, the market was pricing in exceptional execution. FN entered the report near 42.5 times FY2026 non-GAAP EPS, while gross margin remained near 12% and dipped year over year. At the same time, inventory, receivables, and capital spending absorbed far more cash.
Meanwhile, the broader tape magnified the reaction. On August 18, the Nasdaq fell 1.3%, Micron dropped 7.0%, Nvidia fell 2.3%, and Broadcom declined 3.2%. Optical-networking shares also weakened. Fabrinet was a notable negative read-through, but the concurrent sector selloff means it would be inaccurate to assign every peer and large-cap decline to one earnings report.
Before-versus-after investment thesis
Before earnings, the thesis presented Fabrinet as a scaled manufacturing beneficiary of rapid AI data-center and optical-networking investment. Record revenue, accelerating data-center demand, and new capacity could support a multi-year growth runway. The valuation assumed that execution would remain unusually clean.
After earnings, the demand thesis remains intact. Revenue and adjusted EPS beat expectations, the new guide points upward, and the two largest disclosed end markets each grew more than 40% for FY2026. Nevertheless, cash conversion now carries more weight in the thesis.
Ultimately, the central question has shifted. Investors no longer need only proof of orders and revenue growth; they need proof that inventory and capital spending can translate into durable gross margin and free cash flow. Until that evidence appears, FN may trade more like a high-expectation manufacturer than a pure AI growth platform.
Post-earnings bull case
- Revenue grew 44.6% and non-GAAP EPS grew 54.7% year over year, showing operating leverage despite slight gross-margin compression.
- Q1 FY2027 revenue guidance has a $1.400 billion midpoint, which would set another quarterly record.
- Data-center and communications-infrastructure revenue grew 40.8% and 47.4%, respectively, for FY2026.
Post-earnings bear case
- A roughly 12% gross margin leaves less protection if customer mix, pricing, component supply, or factory utilization changes.
- Full-year free cash flow fell 98% as inventory and capital spending surged, so earnings growth has not yet translated into comparable cash growth.
- Four customers generated 57.4% of FY2026 revenue, creating concentration risk around several large programs.
What to watch before the next quarter
- Q1 revenue versus the $1.375 billion-$1.425 billion company range.
- Non-GAAP EPS versus the $4.10-$4.25 range and GAAP EPS versus $3.39-$3.54.
- Gross margin, especially whether it recovers from Q4’s 12.0% GAAP level.
- Inventory growth and operating cash flow as the company converts working capital into shipments.
- Capital spending and free cash flow as new manufacturing capacity enters production.
- Any new detail on data-center, communications-infrastructure, or major-customer demand.
Final earnings verdict
Fabrinet’s Q4 FY2026 result was strong against expectations but incomplete on cash conversion. Revenue and adjusted EPS beat consensus, management’s prior ranges, and the year-earlier results. Moreover, the Q1 guide still points to sequential growth.
Still, the 20.5% selloff carries a useful message. Investors had already paid a premium for rapid AI-infrastructure growth, so slight gross-margin compression and near-zero full-year free cash flow mattered more than they might for a cheaper stock. The next quarter must show not only another revenue record, but also a clearer path from capacity investment to cash generation.
Primary Sources
- Fabrinet Q4 FY2026 earnings release
- Fabrinet FY2026 Form 10-K
- Fabrinet Q3 FY2026 earnings exhibit
- Fabrinet earnings events and webcast
- Fabrinet historical stock lookup
FAQ
Did Fabrinet beat Q4 FY2026 earnings expectations?
Yes. Fabrinet reported $1.316 billion in revenue versus a cited $1.28 billion consensus, a beat of about 2.8%. Non-GAAP EPS of $4.10 exceeded the cited $3.81 consensus by about 7.6%, and both metrics also topped management’s prior ranges.
Why did FN stock fall after a revenue and EPS beat?
FN fell because the market evaluated more than the headline beat. The stock entered earnings with a demanding valuation, while Q4 gross margin slipped, capital spending jumped, and free cash flow turned negative. A broad decline in AI and optical-networking stocks added pressure.
Is Fabrinet an AI stock?
Fabrinet manufactures advanced optical, electro-mechanical, and electronic products used in data centers and communications networks. Its data-center category includes DCI and high-performance computing, which connect the company to AI infrastructure spending. However, Fabrinet does not disclose a separate AI-revenue figure.
What did Fabrinet guide for Q1 FY2027?
Management guided revenue to $1.375 billion-$1.425 billion. It also guided GAAP diluted EPS to $3.39-$3.54 and non-GAAP diluted EPS to $4.10-$4.25. The revenue midpoint implies about 6.4% sequential growth from Q4.
What are the biggest risks after Fabrinet earnings?
The main measurable risks are customer concentration, gross-margin pressure, inventory growth, and weak free-cash-flow conversion. Four customers represented 57.4% of FY2026 revenue, while inventory rose 75.8% and full-year free cash flow fell to $4.2 million.