Why AI Stocks Fell: Inflation and the October 12–16 Selloff
The October 12–16, 2026 trading week exposed two problems for AI investors at once: renewed inflation pressure and growing doubts about the cost of financing the AI buildout. Broad-market funds fell, but the damage was much heavier in AI infrastructure and semiconductors. Several defensive sectors finished higher.
Key Takeaway
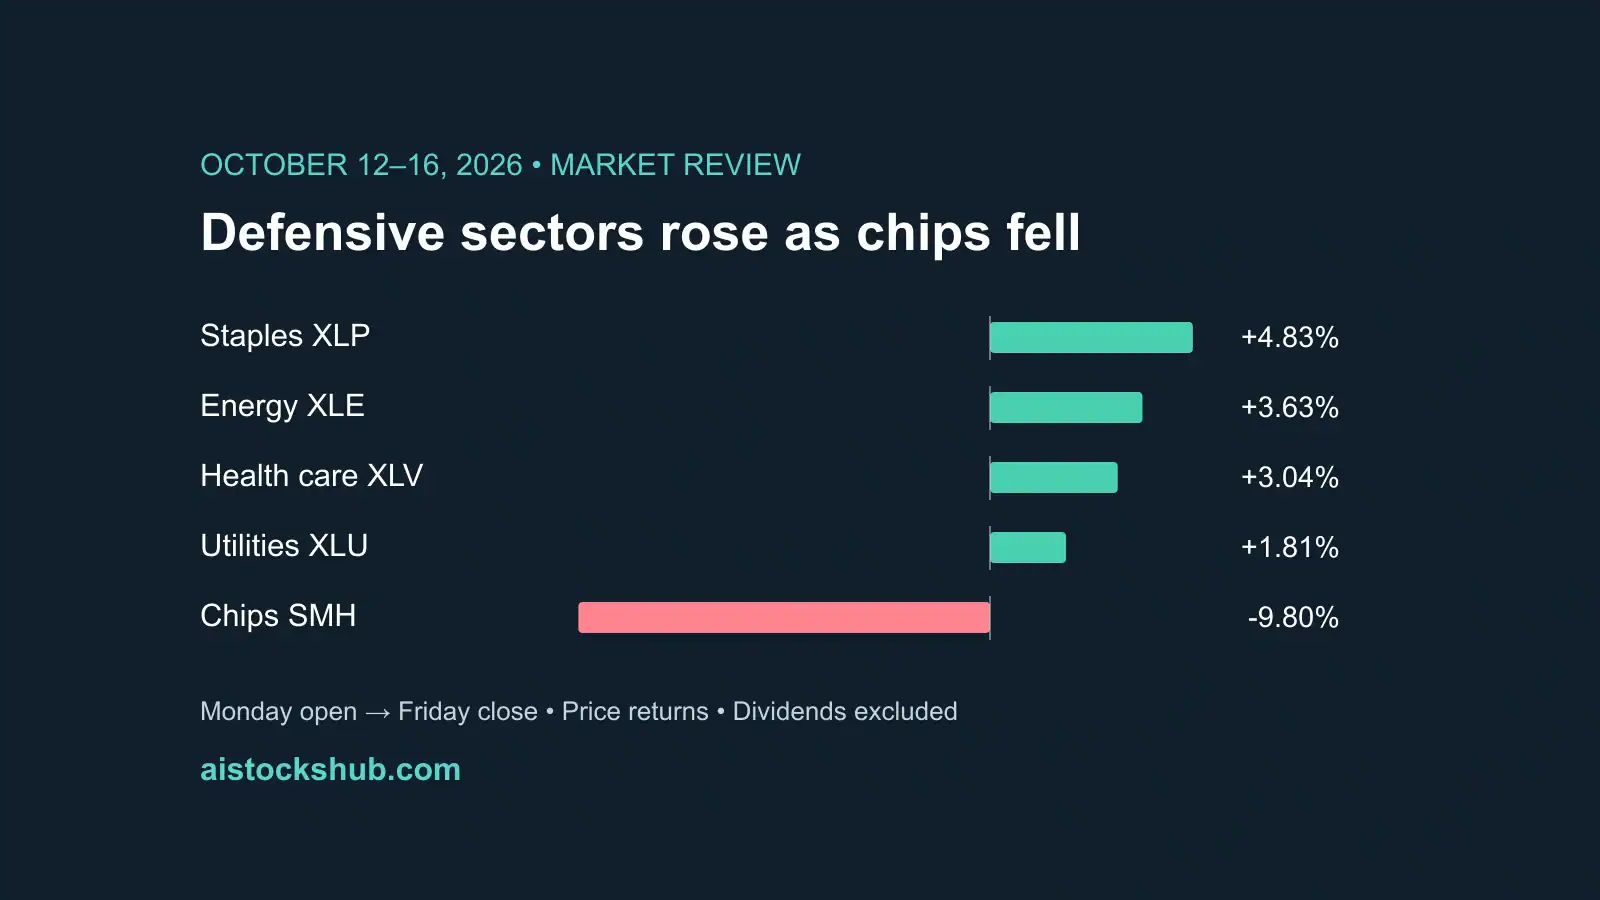
From Monday’s regular-session opening price to Friday’s closing price, QQQ fell 5.32%, compared with 1.99% for SPY. The semiconductor ETF SMH lost 9.80%, while consumer staples gained 4.83%. Inflation amplified a selloff that had already started in AI shares. Funding costs, investment returns and chip competition help explain why the losses were so uneven.
This article is educational, informational research—not financial advice.
We strive to keep data accurate, but unavoidable errors or omissions may occur. Verify important information with primary sources.
What happened this week?
The weakness did not begin with Wednesday’s inflation release. QQQ closed at $746.04 on Monday and $743.57 on Tuesday, already below its $749.69 Monday opening price. The broad-market SPY was comparatively steady over those two sessions.
On Wednesday, October 14, the inflation report increased concern that interest rates could remain restrictive. QQQ closed at $728.95 and SPY at $769.60. That widened the gap between growth-heavy technology exposure and the broader market.
Thursday brought a partial recovery in SPY, which closed at $771.79. QQQ finished at $728.00, slightly below Wednesday’s close. Friday then brought another round of AI selling, alongside renewed concern about higher oil prices. QQQ ended at $709.80 and SPY at $763.25.
The sequence matters. Calling this only an inflation selloff would miss the pressure already building inside the AI trade. Calling it only an AI problem would overlook the broad-market losses and the risk that expensive energy could keep inflation elevated.
Why inflation changed the market’s mood
September consumer prices rose 0.6% from August, up from the previous month’s 0.4% increase. Annual inflation accelerated to 3.7% from 3.4%. Core inflation, excluding food and energy, rose 0.3% for the month and 2.6% over the year. Gasoline jumped 9.1% in September and accounted for more than half the monthly headline increase; shelter rose 0.4%. These figures came from the Bureau of Labor Statistics’ October 14 release.
Why does an inflation report matter to a company selling AI chips or cloud computing? There are two main channels.
First, higher expected interest rates can reduce what investors are willing to pay today for profits projected far into the future. A company can keep growing while its stock falls if investors apply a lower valuation to those future earnings.
Second, financing can become more expensive. Building data centers requires spending on computing equipment, buildings and power infrastructure before all the expected customer revenue arrives. Companies that need repeated access to borrowing markets are especially sensitive to that gap.
The release did not guarantee a particular Federal Reserve decision. Nor did it prove that every AI company would face higher borrowing costs immediately. It made the combination of ambitious spending plans and uncertain investment returns harder for the market to ignore.
The other pressures: AI spending, financing and oil
The return on AI spending was under scrutiny. Investors were questioning how quickly customers could turn large infrastructure budgets into durable profits. That concern can spread from cloud operators to equipment suppliers even without a newly announced order cancellation.
Financing risk became a company-specific issue. Credit-market concerns around AI infrastructure borrowers added another layer of pressure. Equity investors care about whether the next expansion can be financed, on what terms, and how much cash remains after interest payments.
Memory-chip competition added a separate concern. Reports of technological progress at a Chinese memory producer raised questions about future competition. Those reports were a risk signal, not evidence that a particular supplier had already lost a high-bandwidth-memory contract.
Higher oil prices complicated the inflation outlook. Friday’s oil increase added to the market’s unease. Energy producers can benefit from stronger commodity prices, while energy-consuming businesses and households face higher costs. That helps explain why energy shares can rise during a broader equity decline.
These are overlapping explanations, not a measurable allocation of blame. A week’s price changes cannot tell us exactly how much each concern contributed.
QQQ, SPY and IWM: Monday morning to Friday close
Comparison window: Monday, October 12, regular-session open through Friday, October 16, regular-session close, in U.S. dollars. Friday evening after-hours trades are excluded. Returns equal (Friday close ÷ Monday open − 1) × 100 and exclude dividends. This differs from the conventional previous-Friday-close to Friday-close weekly return.
| Fund or company | Monday open | Friday close | Change |
|---|---|---|---|
| Invesco QQQ (QQQ) | $749.69 | $709.80 | -5.32% |
| SPDR S&P 500 ETF (SPY) | $778.78 | $763.25 | -1.99% |
| iShares Russell 2000 ETF (IWM) | $278.47 | $270.44 | -2.88% |
QQQ tracks the Nasdaq-100, SPY the S&P 500, and IWM the Russell 2000. They represent different exposures rather than interchangeable versions of the same market.
QQQ’s heavier growth and technology exposure coincided with the largest decline of the three. IWM’s small-company exposure also fell more than SPY. Smaller businesses can be sensitive to financing conditions, although that general sensitivity alone does not prove why each holding declined.
The clearest finding is relative performance: QQQ lagged SPY by 3.33 percentage points over the requested window. There was a broad downturn, with an additional layer of pressure on technology.
How major AI ETFs performed
The following funds provide a practical comparison of AI-related exposure. This is a selected group, not a ranking by assets or an endorsement. SMH is included as a semiconductor comparison; it is not a dedicated AI fund.
| Fund or company | Monday open | Friday close | Change |
|---|---|---|---|
| Global X Artificial Intelligence & Technology (AIQ) | $66.50 | $62.02 | -6.74% |
| Global X Robotics & Artificial Intelligence (BOTZ) | $35.17 | $33.02 | -6.10% |
| First Trust Nasdaq AI and Robotics (ROBT) | $60.34 | $56.24 | -6.79% |
| VanEck Semiconductor (SMH) | $598.45 | $539.79 | -9.80% |
AIQ offers broad artificial intelligence and technology exposure. BOTZ focuses on robotics and AI, while ROBT follows an AI and robotics index spanning companies with different roles in the theme. Their portfolios are not identical, and global holdings add geographic and currency differences.
Even so, all three thematic funds lost roughly 6%–7% during this window. Owning several AI funds would therefore not necessarily have provided much protection from a common shock to the theme.
SMH’s larger decline highlights the pressure on the semiconductor supply chain. An ETF diversifies individual-company risk; it does not remove the risk shared by companies exposed to the same spending cycle. The relevant question is what a fund owns, not simply how many tickers appear in its portfolio.
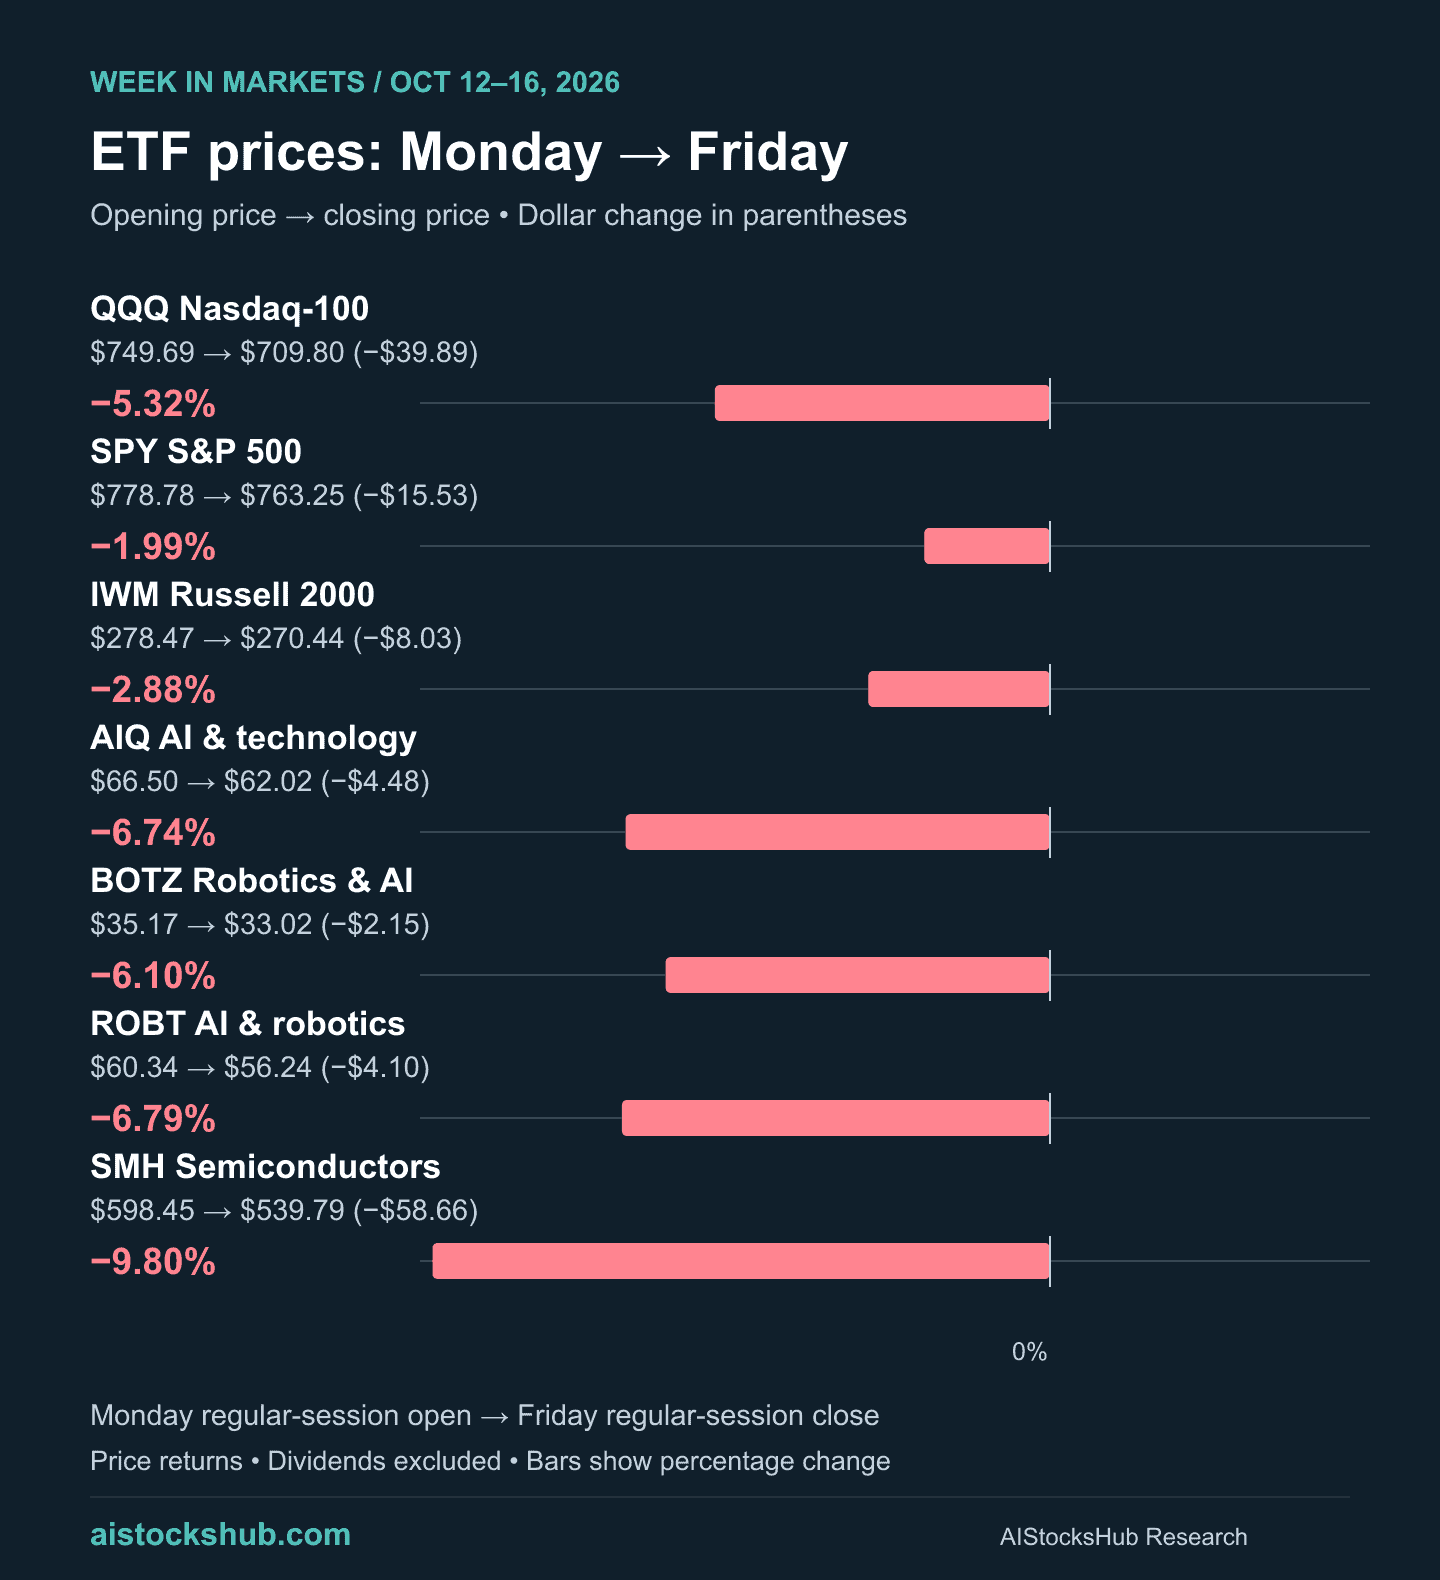
ETF comparison: October 12–16, 2026. Bars compare percentage changes; dollar prices are shown separately because funds have different share prices.
Which defensive ETFs rose while AI fell?
Utilities did rise, but they were not the strongest defensive group in this comparison. Consumer staples and health care gained more. Energy also rose, although its commodity exposure makes it a different kind of holding.
| Fund or company | Monday open | Friday close | Change |
|---|---|---|---|
| Consumer Staples Select Sector SPDR (XLP) | $83.58 | $87.62 | +4.83% |
| Energy Select Sector SPDR (XLE) | $65.85 | $68.24 | +3.63% |
| Health Care Select Sector SPDR (XLV) | $171.49 | $176.71 | +3.04% |
| Utilities Select Sector SPDR (XLU) | $41.46 | $42.21 | +1.81% |
| iShares 0–3 Month Treasury Bond (SGOV) | $100.53 | $100.59 | +0.06% |
| SPDR Gold Shares (GLD) | $382.61 | $382.01 | -0.16% |
Consumer staples sell everyday products, and health care demand often depends less on the economic cycle than discretionary purchases. Their gains are consistent with a market favoring more durable demand. Returns alone, however, do not establish that investors sold AI shares specifically to buy these funds; that would require fund-flow evidence.
Utilities gained 1.81%, providing a positive contrast to AI during this particular week. They are not automatically safe when inflation rises. Their borrowing needs and dividend valuations can make them sensitive to interest rates, while some utilities also carry exposure to data-center electricity demand.
Energy’s 3.63% gain should be read separately. A business selling oil can benefit from the same price increase that hurts consumers and complicates inflation. That does not make an energy ETF a reliable hedge against every market downturn.
Gold was approximately flat to slightly lower, showing that familiar defensive assets do not always rise together. SGOV holds very short-term Treasury securities; its small price movement is not a measure of its full income return. Comparing a few days of price change with a stock fund also leaves out the very different risks and distribution patterns.
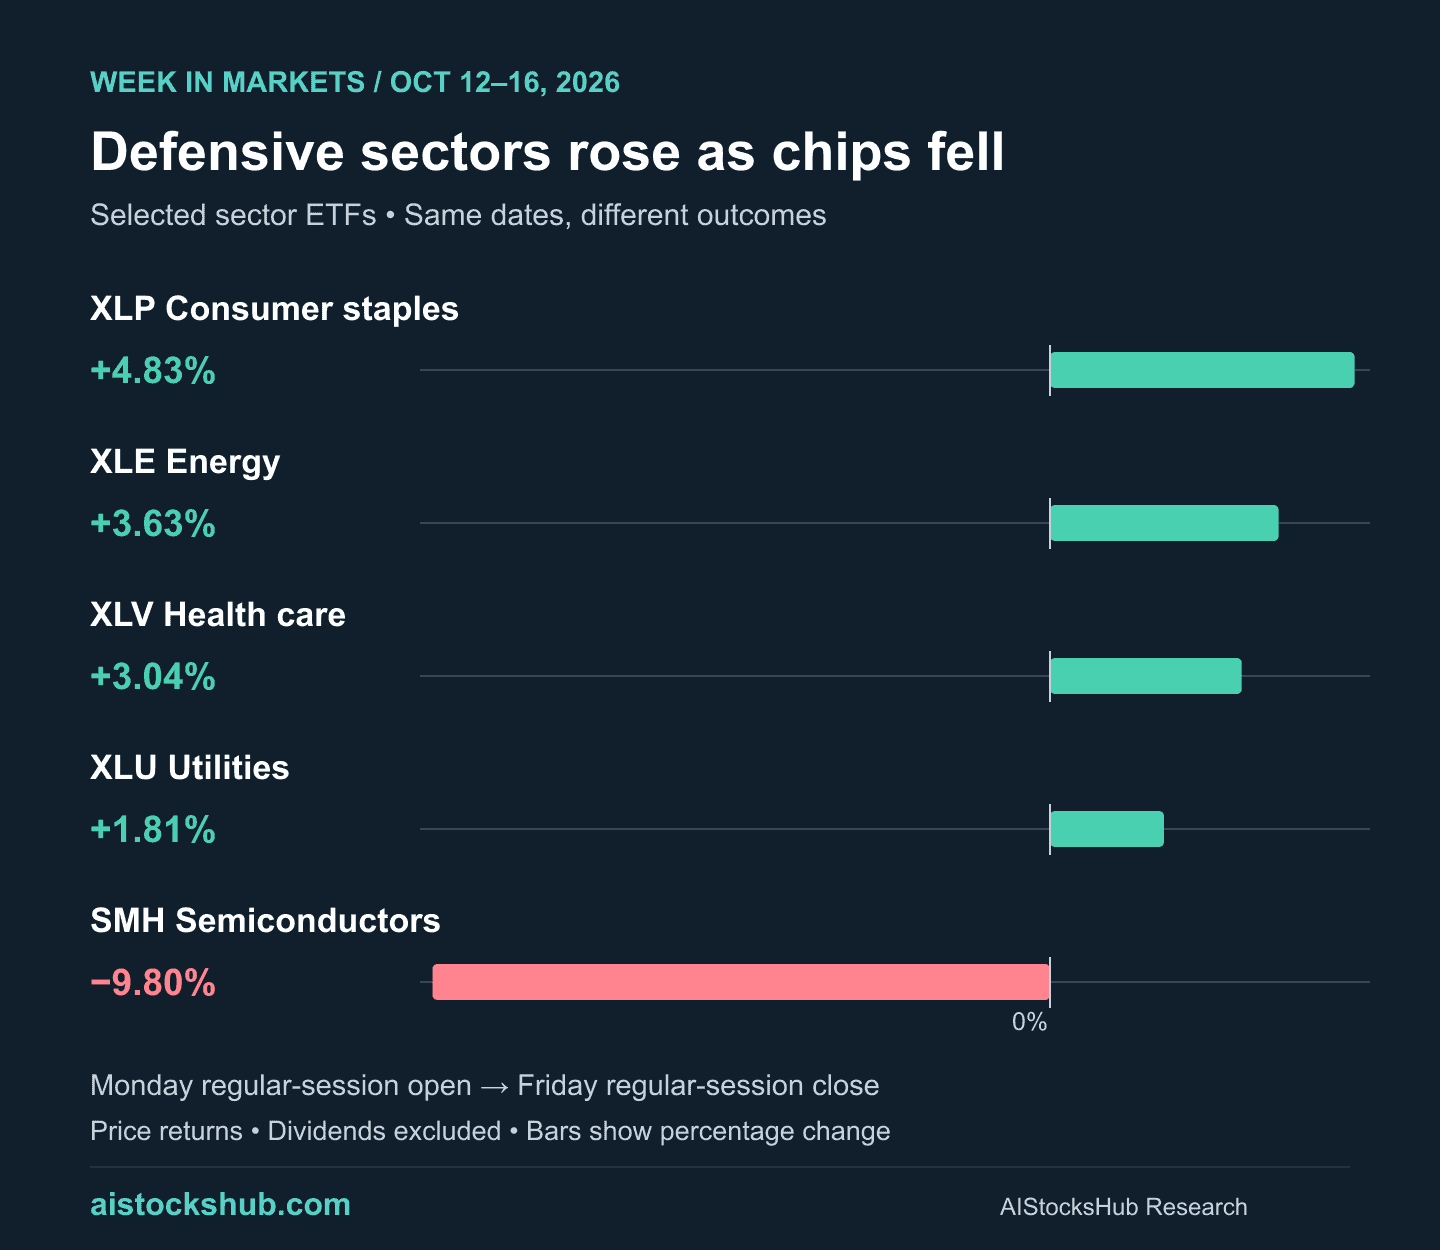
Selected sector ETF proxies over the same Monday-open-to-Friday-close window. Energy is a commodity-sensitive sector, not a universal defensive holding.
Which major AI stocks fell, and why?
The selected stocks below illustrate the spread of outcomes across AI infrastructure, chips and a diversified software-and-cloud business. They are not an exhaustive list of the week’s biggest losers.
| Fund or company | Monday open | Friday close | Change |
|---|---|---|---|
| CoreWeave (CRWV) | $80.33 | $61.39 | -23.58% |
| Micron (MU) | $1,002.45 | $878.84 | -12.33% |
| Advanced Micro Devices (AMD) | $599.93 | $528.75 | -11.86% |
| Broadcom (AVGO) | $359.43 | $328.75 | -8.54% |
| NVIDIA (NVDA) | $228.73 | $214.13 | -6.38% |
| Microsoft (MSFT) | $537.53 | $529.05 | -1.58% |
Micron traded ex-dividend for a $0.15 distribution on October 14. Its percentage above is a price return and excludes that dividend, as do all comparisons in this article.
CoreWeave: funding risk was central
CoreWeave’s 23.58% decline was the largest in this selected group. Concerns about financing the data-center expansion made its debt burden particularly relevant.
Its previously released second-quarter results provide context: revenue was $2.575 billion, net interest expense was $640 million, and the GAAP net loss was $626 million. Interest expense alone was about one-quarter of quarterly revenue. These are figures for the quarter ended June 30, released in August—not new October earnings. See the company’s second-quarter results.
The distinction is between demand and the economics of delivering it. Revenue growth can coexist with heavy interest costs. A falling share price does not establish that customers have stopped buying computing capacity; it can reflect a higher perceived cost of funding that capacity.
Micron: memory competition met a sector selloff
Micron lost 12.33%. It faced the broad reduction in enthusiasm for AI hardware alongside reports of advances by a Chinese memory competitor.
The key uncertainty is whether competitive progress changes supply, pricing or customer choices over time. It would be premature to turn those reports into a claim that Micron had already lost specific AI orders. The price decline is observable; the eventual commercial effect remains uncertain.
AMD: a sharp decline alongside semiconductor weakness
AMD fell 11.86%, exceeding SMH’s decline. Its AI opportunity depends partly on customers continuing to expand computing capacity and on AMD converting that spending into profitable sales.
Questions about the pace and returns of that spending therefore matter to its valuation. That is an exposure-based explanation for vulnerability during this selloff, not proof of a new company-specific earnings miss or customer cancellation during the week.
Broadcom: custom-chip expectations faced the same spending question
Broadcom declined 8.54%. Its AI semiconductor and networking exposure connects it to customers’ infrastructure investment plans.
The market’s scrutiny of the returns on those plans matters even when equipment demand remains substantial. Investors can lower the price they will pay for expected growth before reported revenue weakens. This week’s decline, by itself, does not demonstrate that Broadcom’s expected AI sales disappeared.
NVIDIA: AI leadership did not prevent a decline
NVIDIA fell 6.38%, less than several other chipmakers in this sample but more than SPY. Its position in AI computing did not insulate its shares from concerns about customer spending and financing.
The distinction for investors is between a supplier’s competitive position and the valuation attached to its growth. A strong business can still experience a sharp stock decline when the market changes its assumptions about customers or required returns.
Microsoft: a useful counterexample within AI
Microsoft fell 1.58%, holding up better than SPY and far better than the selected chipmakers. Its diversified software and cloud operations provide a different earnings mix from a company concentrated in memory chips or data-center financing.
That business mix is a plausible reason for relative resilience, not a proven attribution of the week’s return. The comparison still makes an important point: the label “AI stock” covers companies with very different cash flows, funding needs and risks.
What matters after the selloff?
The next useful checks are concrete. Does inflation pressure broaden beyond energy? Can AI infrastructure borrowers finance expansion on workable terms? Do customers maintain their spending plans, and do suppliers convert those plans into revenue and cash flow?
For the companies themselves, watch interest expense, cash generation, funding commitments and actual customer demand. For the market, watch whether weakness remains concentrated in AI infrastructure or spreads further into the broader economy.
This week showed a broad decline with much larger losses in AI-sensitive exposures. It also showed that defensive sectors could gain while technology fell. Neither observation makes every AI decline a buying opportunity or every defensive winner a safe investment. The useful distinction is between a lower share price and a measurable change in a company’s ability to fund growth and earn a return on it.
Primary Sources
- Bureau of Labor Statistics: September 2026 Consumer Price Index
- CoreWeave: second-quarter 2026 financial results
- Global X: AIQ fund strategy
- Global X: BOTZ fund strategy
- First Trust: ROBT fund strategy
- VanEck: SMH semiconductor fund
Price methodology: publicly aggregated regular-session market-price observations, retrieved after the October 16 close. Prices are displayed to cents; percentage changes use the underlying unrounded observations. These are ETF market prices, not fund net asset values. Figures may differ slightly across closing-price feeds.
FAQ
What is inflation? Can you explain it with an example?
Inflation is an increase in the general level of prices over time, which reduces how much money can buy. For example, imagine a representative basket of goods and services cost $100 last year and costs $103.70 this year. That is 3.7% annual inflation: you need $3.70 more to buy the same basket. This is an illustration, not an actual household bill. Individual prices can rise faster, rise more slowly or fall, so your personal experience can differ from the national average.
Did inflation cause the entire AI stock selloff?
No. QQQ was already declining before Wednesday’s report. Inflation increased concerns about valuation and financing, while AI investment returns, borrowing conditions and memory competition added separate pressures.
Why do these figures differ from reported weekly returns?
This article starts at Monday’s opening trade and ends at Friday’s regular-session close, as requested. Standard weekly returns usually start at the previous Friday’s close. These figures also exclude dividends and after-hours trading.
Which AI ETF fell the most in this comparison?
Among the three dedicated AI and robotics funds shown, ROBT fell 6.79%, AIQ fell 6.74% and BOTZ fell 6.10%. The semiconductor comparison fund SMH lost more, at 9.80%, but it is not a dedicated AI ETF.
Did utilities protect investors during this downturn?
XLU gained 1.81% over the selected window. Consumer staples and health care gained more. That is evidence of relative resilience this week, not a guarantee that utilities rise whenever the broader market falls.
Which selected AI stock held up best?
Microsoft had the smallest decline in the six-stock comparison, at 1.58%. CoreWeave had the largest, at 23.58%. The spread shows why financing needs and business mix matter within the AI theme.